Improve Workload Resilience With z/OS Workload Interaction Correlator and z/OS Workload Interaction Navigator
IBM has two new contributions to the IBM Z family: A data infrastructure provided by z/OS Workload Interaction Correlator and a visualization engine driven by z/OS Workload Interaction Navigator.
As IBM Z continues to be an integral part in the journey to cloud, identifying the source of problems is becoming increasingly complex. Much of the workload and its interdependencies running on IBM Z continue to be a “black box.”
What approach would you take to diagnose a mainframe workload performance issue today? As the various middleware workload components are usually intertwined, a typical remediation starts with a detailed analysis by middleware silo, followed by attempting to find commonalities across these multiple silos. The myopia of silo analysis however often makes it difficult to identify the root cause of complex problems with many interdependencies.
To address these issues, IBM has delivered two exciting new contributions to the IBM Z family: A data infrastructure provided by IBM z/OS Workload Interaction Correlator (Correlator) and a visualization engine driven by IBM z/OS Workload Interaction Navigator (Navigator). Note that Correlator is a z/OS priced feature, and Navigator is a separate, priced product.
Interacting Trends
The Correlator and Navigator technologies are built on the concept of “interacting trends.” With high utilization of shared mainframe environments, it’s critical to know how interdependent workload components are interacting with one another over time. Work arrival pattern changes can negatively impact workload component availability. Interacting trend technology specializes in dynamically recognizing the full impact of work arrival pattern changes over time.
There are two major inhibitors to gaining insight into these changes:
- Data collection is either too broad (e.g. RMF 15-minute interval data) or too granular (middleware per transaction data)
- Each middleware component has its own unique data format
Achieving standardization requires synchronizing SMF record generation across all participating z/OS components and middleware. With Correlator, at the top of each minute and every five seconds thereafter, a single trigger drives the generation of the SMF records for all participating peers. This record synchronization enables activities from across the entire z/OS stack, to be correlated in ways that were never before possible.
Interacting trend technology overcomes the above inhibitors, by generating summarized data at a high frequency, and a standardized format across the z/OS and middleware stack.
From a visualization perspective, traditional middleware monitor technology leaves the decision on how to summarize the data as an exercise for the problem determination analyst(s). There may be a team of subject matter experts (SMEs), one per middleware component which can prove costly, not only in consulting costs, but also in CPU and disk costs to produce the detailed data. There’s also no easy way to directly compare and contrast the individually summarized silo data.
Interacting trend technology takes a radically different approach in that it prescribes how the data is summarized for analysis, as part of its data generation. This enables low cost, context rich data generation (Correlator), while requiring only a lightweight visually intuitive analytics engine (Navigator).
IBM z/OS Workload Interaction Correlator
Correlator is a radical new approach that enables direct correlation of interacting anomalous activities across the entire z/OS and middleware stack at low CPU cost while providing high value context rich data.
The Correlator infrastructure is designed to be consumed by both z/OS and middleware exploiters. Correlator prescribes how each exploiter’s summary data is generated. Ultimately this synchronized, standardized approach to data generation enables the ability to dynamically identify and correlate disparate client-specific performance anomalies. This correlation capability will help clients implicate or exonerate workload components, where correlated anomalous activities are implicated, and non-anomalous activities are exonerated.
IBM z/OS Workload Interaction Correlator is a priced feature of IBM z/OS. It requires IBM z14 or z15 hardware and support will be in the PTF for APAR OA57165 for IBM z/OS V2.3 and V2.4.
IBM z/OS Workload Interaction Navigator
Navigator is a visually intuitive analytics engine designed to:
- Provide visibility into interdependencies and interactions across workloads
- Dynamically recognize anomalous behavior across one or two interval periods over multiple subsystems
- Enable SMEs to determine cause and victim relationships across the IBM Z software stack
- Improve workload availability by providing a method to validate effects of environment changes
During a performance engagement, an SME can become overwhelmed trying to glean insights by delving through volumes of middleware instrumentation data flowing from and across multiple systems and applications. Today, they need to manually parse, correlate, and understand the cause, location, and scope of a problem.
Navigator addresses this challenge by consuming and interpreting data from the IBM Correlator infrastructure. The data generated is standardized and synchronized on short time intervals, allowing Navigator to easily visualize workloads across processor core types, job size, and job priority. Through this data visualization and analysis, performance-based anomalous behavior can be detected, enabling early problem definition, before it can cause an outage.
More importantly, the correlation of anomalies helps SMEs easily determine which activities are the root cause of the anomalous behavior versus “false positives” that may only be symptomatic of the root issue. Understanding correlation is a key step toward generating insights.
Because of the patented techniques used to generate the data, Navigator provides a lightweight browser-based analytics engine capable of generating actionable insights.
Navigator is a separate, priced product that requires the following:
- IBM z/OS Workload Interaction Correlator
- IBM Z Distribution for Zowe
Use Cases
Using Navigator enables clients to quickly implicate or exonerate workload components with the push of a button.
For example, reoccurring peaks in CPU time for a workload component that includes Db2, may be correlated to a CICS workload component’s reoccurring CPU time valleys. With its correlation capability, Navigator can identify the Db2 and CICS workload components as “Cause and Victim” peers. Figure 1 below provides an example of how “CPU time consumed” is an Interacting Activity for both peers.
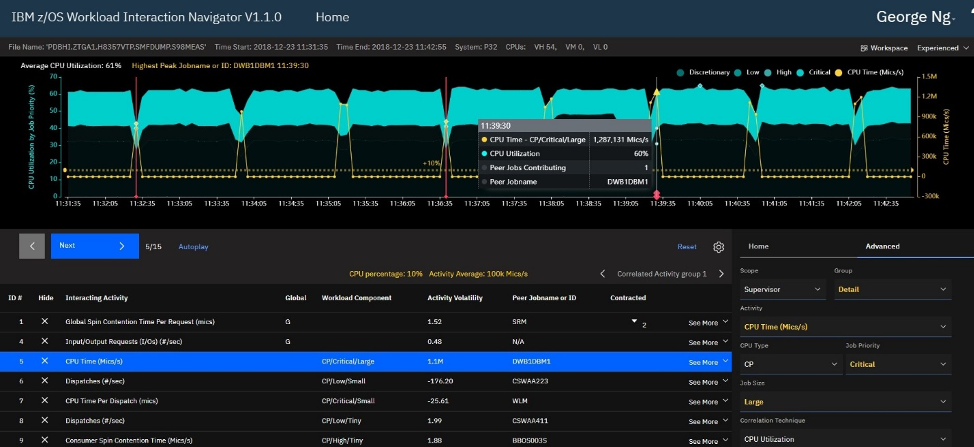
For a given 15-minute interval, impactful Interacting Activities that have five-second Interacting trend deviations from their baselines, are dynamically detected. Interacting Activities with (reoccurring) Peaks/Valleys over time are correlated to other Interacting Activities, whose workload components are then identified as “Cause and Victim” peers. This intuitively describes the full impact of changes that occur over time.
A second example is hardware upgrades, where interacting trend data is captured both before and after machine upgrades to identify potential problematic workload component focus areas (e.g. CPU consumption differences).
While clients can’t control work arrival patterns, when armed with the insights from Navigator they can manage the rate of work consumption within their system. Reconfiguring a workload component to better manage throughput has always been possible but there was no data available to enable an informed decision. Navigator provides that key feedback, enabling clients to make informed workload component governance decisions rather than the sometimes ineffective alternative of throwing hardware or money at the problem.
Need Help?
Clients are encouraged to use Navigator to identify problem areas, determine a corrective action and take that action. Interacting trend technology provides a direct feedback loop that enables clients to determine progress toward meeting availability or performance goals.
If a client feels they are ineffective in using Correlator or Navigator in determining the corrective actions to be taken, then enhanced services, such as a study to review a client’s Interacting trend data to provide specific recommendations, are available from IBM Z Lab Services. Send an email to ibmsls@us.ibm.com for more information.
Additional Information
- IBM z/OS Workload Interaction Correlator Announcement
- IBM z/OS Workload Interaction Navigator Announcement