The Art and Science of AIX Performance: Configuration and Logs
Once you've compiled a detailed history of system performance issues, the next step is to brush up on the finer points of your AIX system configurations.
I’m often asked about my approach to the diagnosis and remediation of AIX system performance issues. This series of articles lays out my methodology. My intent is to show how you can adapt my methods to your own environment and needs, keeping those elements that suit you and modifying others to a specific purpose. As I said in part one, although you need to follow the scientific method to analyze and fix performance issues, this process is foremost an art form. Once you get beyond the common steps necessary for diagnosis, remediation becomes a wholly individual effort where you will select you solutions from a nearly unlimited palette, mixing new and inventive cures for performance issues.
Part one examines two initial and essential steps in diagnosing performance issues: 1) making sure your system has current levels of firmware installed, and 2) taking a thorough, detailed history of the problem(s) you’re experiencing. Again, keeping current on firmware is the simplest and most effective way of dealing with performance issues before they even come up. But once you’re facing a problem, you must understand the situation fully before you act. That’s why taking a history is so important.
Configuration
Now let’s move forward. Once you’ve compiled a detailed history, the next step is to brush up on the finer points of your AIX system configurations. Of course if you’ve been working at a particular site for any length of time, you should be intimately aware of how all your systems are put together. In contrast, if you’re a consultant hopping from one job to the next, you may be less familiar with any individual customer environment. In either case though, unless you have a photographic memory, you’re not going to remember every last detail of an environment that encompasses perhaps dozens, if not hundreds, of systems. This is especially true when an issue must be resolved quickly (as most of them must be); many of us lose those finer points in the heat of the moment.
This is why it’s essential to compile concise configuration listings. Take note of two documents that are easily obtainable from any AIX system: a prtconf and the config.sum file. These outputs list critical information you’ll need to open a service call with IBM Support, including the system’s machine type, serial number and AIX version. You should keep both close by at all times, and update them whenever configurations change. That way, if a system is down hard, you’ll have a ready reference to guide you through a rebuild. Choose any display method that’s accessible. For instance, I keep prtconfs tacked to the walls of my cubicle and config.sum files in a big binder.
The prtconf lists basic information about a system’s configuration. In addition to the aforementioned items, it also includes things like a system’s platform (P6, P7, P8, etc.), firmware version, networking information and storage structure. You’ll need the prtconf when you’re talking to IBM Support.
Generating a prtconf is easy: from an AIX command prompt, do this:
prtconf > system_name_prtconfThen print two copies: one for your office and one for home for those middle-of-the-night emergencies.
Next in your configuration arsenal is the config.sum, which is generated by the IBM performance diagnostic utility PerfPMR. The config.sum greatly expounds on the basic information presented in a prtconf. In fact, there’s likely more information here than you’ll ever need. Believe me, though: when you’re talking to support, this level of detail can be a life saver. I covered config.sum in my PerfPMR series
As a refresher, here’s the command for generating this file. Run it as root:
perfpmr.sh –x config.shMake sure all your PerfPMR commands are run from a directory separate from where the utility is installed. Having a directory called /tmp/perfdata on all your systems is a good choice, since the location is easy to remember. On some systems―particularly those with perhaps hundreds of storage components like hdisks and logical volumes―a config.sum can take a considerable amount of time to generate. This is another reason to keep an updated config.sum in hard copy: When you’re trying to diagnose a performance issue and time is tight, you want to devote that time to actual problem management.
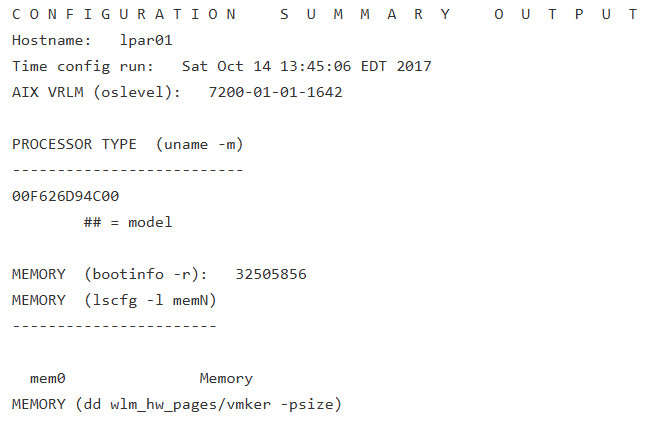
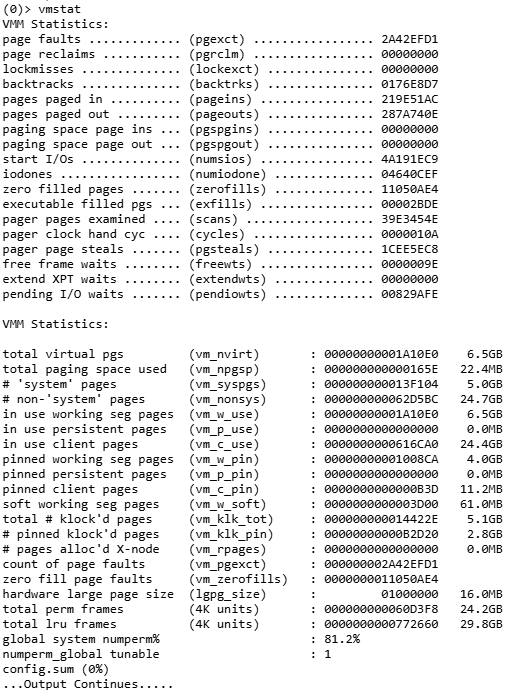
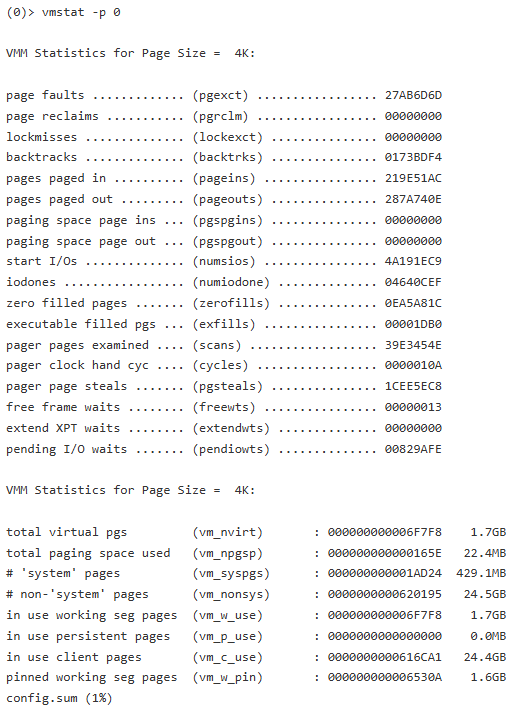
A config.sum’s initial output is much like a prtconf. It displays your system’s name, AIX version and serial number (see Figure 1 below). But after that, it dives deeply into how that system is put together. The first 5 percent or so is devoted to memory and how it’s parceled out in your system. This portion contains detailed kernel information about the virtual memory manager, the memory page sizes in use on your system, and how many of each type are in use. You’ll see how many pages are devoted to working, file and client types, how much memory is devoted to filesystem caching data and how memory is striped (see figure 2A below).


In addition, there’s an extensive listing of the many switches that control the virtual memory manager and how they’re set. Finally, you’ll be introduced to a new way of running the familiar vmstat utility: When it generates a config.sum, PerfPMR invokes vmstat in a way not available from the command line (see Figure 2B below). Take the time to learn this output. It’s invaluable for diagnosing bad memory problems or system dumps.

Following the memory output, you’ll get a listing of all your system’s interprocess information, including the number of shared memory segments, semaphores and message queues in use as well as their access and modification times (see Figure 3 below). Next comes the biggest section of config.sum output: your device information. I know of no utility that presents device information in as exacting detail as config.sum. Every last feature of volume groups, logical volumes, filesystems, disks and arrays is presented. Likewise, network adapter and interface data are just as detailed, as is processor information. The next section includes the output of more memory attributes and a terse listing of system tunables for CPU, memory, storage and networking. Then follow two very long listings detailing the trace attributes of your system’s components and installed software. Finally, config.sum output concludes with a listing of vital product data for every installed component, including device firmware information.

Much of the output contained in the config.sum is obtained via the kernel debugger tool (kdb). (Here’s a primer.) To learn what this output means, invoke the kdb on a test system and type in the commands you see listed. Contextual help is available for many of these commands: Simply issue a specific command at a kdb prompt, followed by a question mark (?).
Try to memorize your prtconf output and learn as much as you can about the data contained in the config.sum file. Doing both will help you effectively diagnose complex performance issues.
System Logs
Logs contain a treasure trove of system information. AIX has dozens of different operating system logs―to say nothing of those available for databases, applications and middleware. The information in different logs is apropos to different situations. You need to develop an instinct for which log will aid you in a given situation in your particular environment.
AIX has dozens of logs (and dozens more for databases and applications). Here are a few I consider most important:
* AIX error reports―Everyone reading this is familiar with AIX error reports. Either in its short form or its verbose mode, the error report is the starting place for information about any adverse events that have occurred in your system. While error reports include many flags, I generally only use the -a flag―this gives me detailed information about system errors. The other flags simply arrange the information in different ways.
To get a quick, high level view of system trouble, I’ll typically issue “errpt” at a command prompt. I scan this output, zeroing in on items of interest by running errpt –a. Yes, I know that an “errpt –a –j” will pinpoint any particular error, but a lot of error report information is contextual. What happened preceding and following an error may be critical to finding its cause and determining how to attack it.
The error report presents its information according to a hierarchy of severity that’s divided into six categories:
Informational (INFO)
	Pending (PEND)
	Performance (PERF)
	Permanent (PERM)
	Temporary (TEMP)
	Unknown (UNKN)
If I’m in a hurry, I’ll go straight to PERM. PERM errors always accompany bad system events like dumps, filesystem corruption or device failures. They cannot be fixed by AIX and won’t go away on their own. They can only be remediated by human intervention. A PERM error is a direct pointer to something that you must pay attention to, something that’s very likely a factor in your performance difficulties.
Get in the habit of writing the error report to a file each week. This information can tell you a lot about your system’s health and stability. You may see one type of error lead to another, or―most tellingly―a temporary error rapidly flip to permanent. Maintaining an archive of error reports allows you to put these events into context (which, again, is part of the art).
* bootlog―Located in the /var/adm/ras directory, the bootlog, as you might guess, tells you about the events that occurred in a system since it most recently went live. Very often in performance diagnosis, subtle hints contained in the bootlog point to future problems. Of special interest is the amount of time each event took. Do you see all of the hdisks in your system being validated by config manager very quickly, only to have one or two take an inordinately long time? Did an adapter generate any error messages? Did config manager hang for a lengthy time during CPU initialization? The bootlog is an alog file, so it must be read with the alog utility, like this:
alog -f bootlog -o|moreWhile the bootlog contains only information about a system’s most recent IPL, it’s useful to print it out―or at least FTP it to a central repository. That way, if your system is down, you can refer to it quickly and cull any information from it that may be germane to the problem at hand.
* bosinstlog―This tells you about the history of a system’s installation. While this is typically dated information, you should scan the bosinstlog to determine if any problems were missed during installation. The bosinstlog is also an alog file, so use the same syntax in reading it that you would with the bootlog. The bosinstlog is located in /var/adm/ras.
* cfglog―The configuration log amplifies the events on the bootlog. It tells you about the success or failure of device initialization and points you to any errors encountered in making a device live. An alog file, the cfglog is located in /var/adm/ras.
* conslog―In the early days of UNIX, errors that significantly impacted a system’s stability were written to the console, a monitor directly attached to a system. Over time as networking eliminated the need for terminals, these errors were simply directed to a file, but the name has stuck. Depending on how many versions of the conslog you keep, the files may be very large and contain events dating back years. In performance analysis, look for events that occurred around the time your problem started. An alog file, the conslog is located in the /var/adm/ras directory.
* devinst.log―When you installed your system, remember how progress was indicated by a percentage of completion and the software packages that were being installed on screen? The device install log is a printout of that information. It’s invaluable in pinning down errors that may have occurred when a piece of software was installed, particularly when it comes to failed dependencies. Oftentimes during the install, the info onscreen scrolls so quickly that you can miss an important error. Does a performance error include the repeated core dumping of an executable? Check the device install log for install errors that may not have been severe enough to cause the installation to abort. A text file, the devinst.log is located in /var/adm/ras.
* diagrpt―If you cd to /etc/lpp/diagnostics/data, you’ll find a bunch of files created periodically by the diagd demon. Collectively, these files represent the system diagnostic report and can be read with this command:
/usr/lpp/diagnostics/bin/diagrpt –a | moreOf particular interest in the diagnostic report is the “Description” field, which will tell you about any trouble encountered by diagd with system components.
* syslog―The system log is one of the most powerful diagnostic logs available to AIX administrators. By default, syslog isn’t turned on in AIX, though the syslogd demon that manages it always runs. This means that how you choose to record syslog data is up to you. These sensitivity levels―called “priorities” in AIX―are available:
emerg―For emergency messages.
	alert―For important messages.
	crit―Critical messages not specified as errors like improper login attempts.
	err―Messages that do represent error conditions such as unsuccessful I/O.
	warning―Messages that specify abnormal but recoverable conditions.
	notice―A catchall for messages that are important but don't fall into another category.
	info―Informational messages of low impact.
	debug―Messages that as you might suspect aid in debugging problems.
	none―Well, you get the idea.
It’s good to enable the system log following―or even during―a performance event. Bear in mind that collecting all the data at the higher priority levels, while useful, may itself impact system performance, so use the system log judiciously. Also by default, the system log writes its data to the /var filesystem. Operating at high priority, syslog can fill /var, something that you obviously don’t want to see. So make a backup copy of /etc/syslog.conf and then call up that file in an editor. Add this line to the bottom of the file:
*.debug /tmp/perfdata/syslog/syslog.out rotate size 1m files 7
This will record syslog data in the /tmp/perfdata/syslog directory and start writing to a new file when the log reaches 1 MB in size. Then syslogd will begin labeling the files sequentially as syslog, syslog.0, syslog.1, etc.
Next, create the syslog directory and file, and then send a signal to the syslogd to start logging with your desired sensitivity:
# mkdir /tmp/perfdata/syslog
# touch /tmp/perfdata/syslog/syslog.out
# refresh -s syslogd
0513-095 The request for subsystem refresh was completed successfully.
Now you have a log that will pick up many untoward events that affect your system’s performance.
Successful log management and interpretation in your environment requires you to decide, based on the situation, which logs may benefit you and which you may discard. This intuitive ability can only be developed by studying your system when it’s healthy and getting to know all of the log data it produces. That way, when a performance problem presents itself, you’ll know where to start.
Spread the Word
Reading configuration files and logs aren’t flashy activities. In fact, management types may question why you’re looking at these files when there’s “actual work” to be done. Of course, you know better. Not understanding your system’s configuration or ignoring any of the multitude of negative events that can occur on it can have disastrous consequences. At the very least, it will delay your performance diagnoses considerably. So make the bosses aware that regularly scanning configs and logs is just as important as adjusting tuning dials. Print out this data and show it to them, explaining any anomalies you see. Then they’ll see how vital these activities are.
In the next installment, I’ll go through the tools I use to diagnose performance issues. From stat to mon to trace, you’ll learn about the utilities I’ve found that yield the best information about performance issues. Stay tuned.