A Simplified Approach to Understanding z/OS Performance
Knowing and understanding the performance of z/OS systems has always been important for enterprises as mission-critical business processes run in z/OS systems. Each mainframe shop has its own way of dealing with performance, which is a factor of in-house skills. As deep technical skills are becoming rare, a simplified approach to z/OS performance can help address skill challenges. In this article, I’ll discuss a simplified approach to understanding z/OS performance, and how simple tools like Resource Measurement Facility (RMF) Postprocessor and RMF Spreadsheet Reporter can help.
Collecting Performance Data
To understand the performance of a z/OS system, we need performance data for analysis. RMF is a component of z/OS that gathers system wide performance data but needs another z/OS component to write the data. System Management Facility (SMF) is the z/OS component that writes data on behalf of other z/OS components and subsystems including RMF. SMF writes these data as records in its operational data sets or log streams. SMF records are of different types, each type has a unique number that identifies the record structure and the z/OS subsystem that generated it. Since SMF record types 70 to 79 are the ones generated by RMF, we can use these to analyze and understand performance.
Top-Down Approach
There are different approaches to understanding z/OS performance. A top-down approach is quite simple and easy to adopt for getting to know the health of your z/OS systems. The idea is to understand how well z/OS systems are operating layer by layer. At each layer or level, we try to get a view to system activities and resource consumption as an indicator of the health of the system at that level. We start at the top at the CEC Level (IBM Z hardware level), then go down to the next level or layer, the LPAR level. From the LPAR level, we can go down to z/OS workload management (WLM) level to understand how the workloads are doing and as needed we can go further down to subsystem or application level. Figure 1 shows the top-down approach that can be extended to subsystem or application-level drill down.
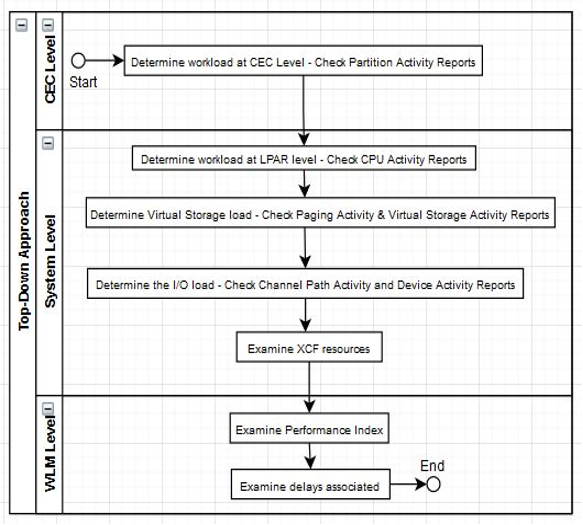
In this pursuit, there are tools and utilities available in z/OS that can help. RMF Postprocessor is a component of RMF that is very handy and can generate different performance reports from SMF 70-79 records. RMF Spreadsheet reporter is another component of RMF that can help visualize the above reports as charts in Microsoft Excel spreadsheet.
A Look at the Levels
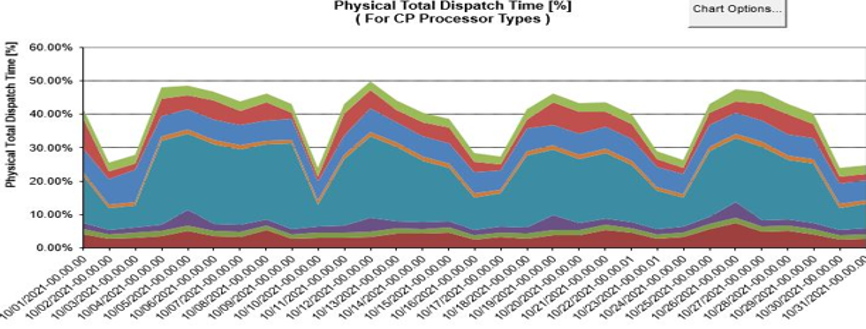
At the CEC Level, we can try to understand how the processors like general purpose processors and specialty engines are being utilized by different LPARs and whether there is any contention for processing power. Partition Data Report generated by RMF Postprocessor can help understand how processors are being used by different LPARs. RMF Spreadsheet Reporter can be of great help by pictorially representing such reports as shown in Figure 2, each color in the charts represents an LPAR.
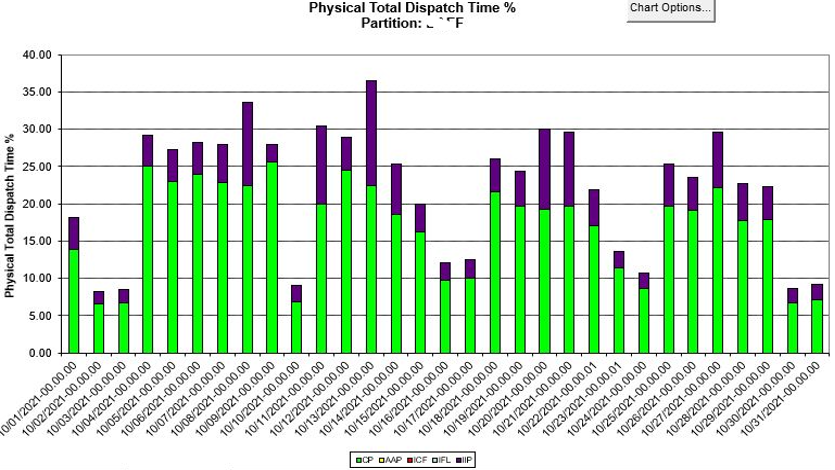
At a LPAR level, we can understand how a particular LPAR is making use of its processor share. CPU Activity Report generated by RMF postprocessor can help understand this and RMF Spreadsheet Reporter can graphically represent these reports as shown in Figure 3.
At the LPAR level, we can also look at virtual storage utilization, paging activities, channel path activities, device activities and XCF activities to see if there are any challenges with virtual storage, I/O device response times and XCF resources. RMF Postprocessor can generate reports for these and RMF Spreadsheet reporter can generate charts for pictorially visualizing these.
The next level is WLM level. Here we can understand how WLM is servicing different workloads sysplex wide, by making system resources available to workload at the right time and rate. Workload Activity report generated by RMF Postprocessor can help us understand this by examining Performance Index and delays associated with WLM service classes serving the workloads. Workload Activity Trend Report of RMF Spreadsheet Reporter can pictorially show these for easy understanding.
If required, we can go to the next level where we can examine each subsystem like CICS and Db2 to understand the health of each. This may require deeper knowledge of the subsystem of interest and may also require different SMF record types which may have to be gathered.
Using the Right Tools and Performance Data
Using a simple approach to understanding z/OS performance can be accomplished with tools like RMF Spreadsheet Report and RMF Postprocessor. With the right tools and performance data available, you can drill down to the level of understanding needed in order to ensure optimum performance of your mission-critical business processes on z/OS.