IBM i Performance Data Investigator: Memory Allocation Perspectives
IBM’s recent enhancements to the Performance Data Investigator (PDI) charting engine includes some new memory perspectives (charts) which provide additional usage statistics that help visualize and understand memory usage on your IBM i partition.
IBM i memory tuning has traditionally been a dark art: adjust tuning parameters and see how the system behaves. It was difficult to determine if you had excess memory in a pool—the general approach involved taking memory away until performance suffered, then adding some back.
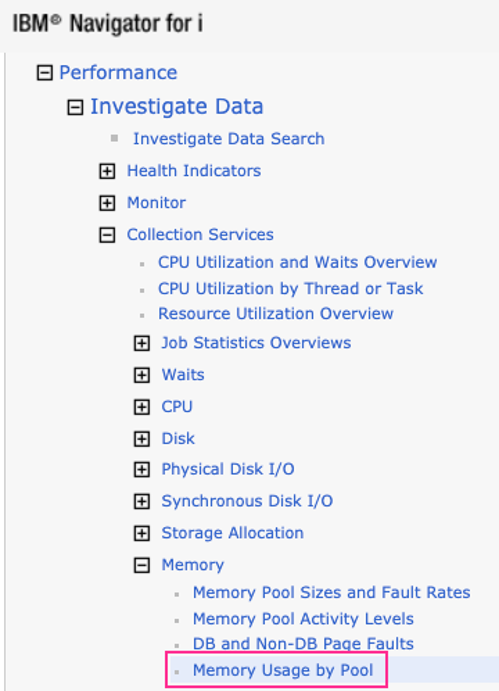
You find this new perspective in the Memory section of the Collection Services tree, named Memory Usage by Pool (see Figure 1).
There are four charts within this perspective:
- Memory Usage by Pool is the first chart displayed. This chart shows how much memory is allocated by each memory pool. The memory used may increase and decrease throughout the collection as various workloads running within the pool change.
- Memory Usage Peak by Pool shows peak values for that pool; maximum pool size, maximum pool space allocated and maximum pool space unallocated.
- Memory Usage Minimum by Pool shows minimum values for that pool; minimum pool size, minimum pool space allocated and minimum pool space unallocated.
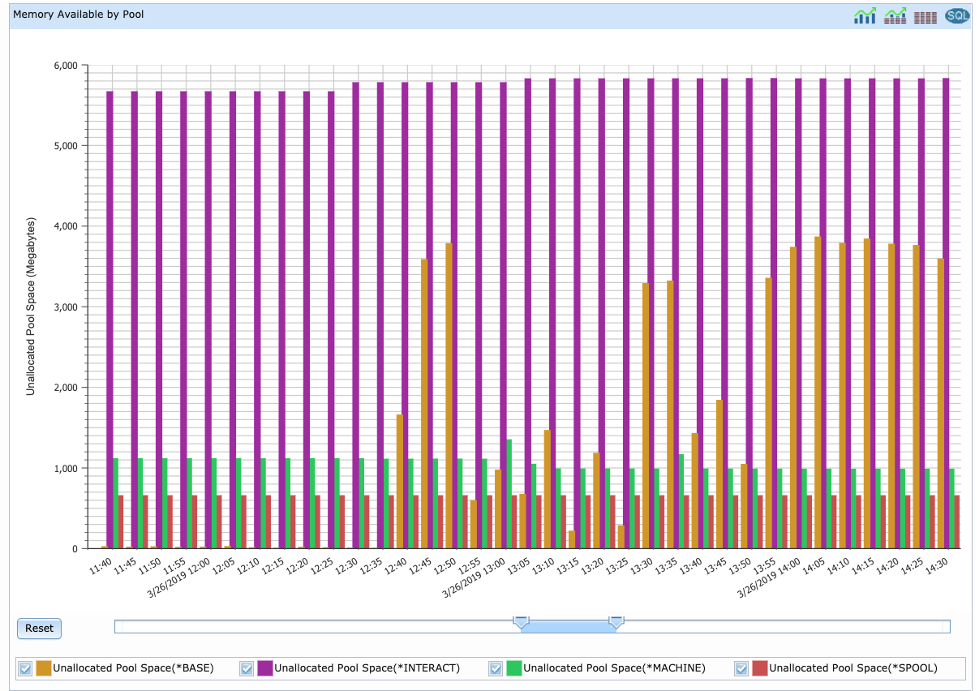
- Memory Available by Pool is the last chart displayed. This chart shows how much unallocated memory is in each pool. This chart, in my opinion, is the most valuable chart. You may discover that some pools have quite a bit of unallocated memory, while others do not. This information is very helpful for tuning your memory configuration.
Figure 2 is an example of what the Maximum Usage Peak by Pool chart looks like:
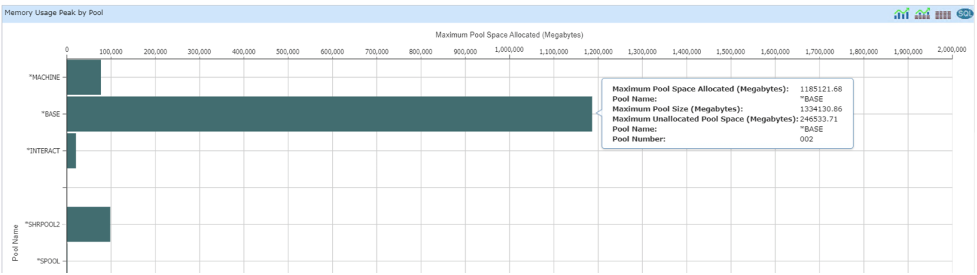
Figure 3 is an example of what the Memory Available by Pool chart looks like:
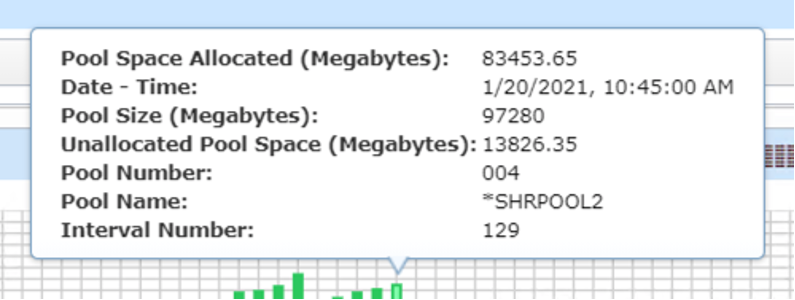
The flyover shows three metrics for an interval: pool size, allocated pool space and unallocated pool space. The allocated pool space and unallocated pool space add up to the pool size (see Figure 4).
You will also want to review the Memory Pool Sizes and Fault Rates perspective. The charts in this perspective show memory pool sizes and fault rates over time. If you’re using the performance adjuster, you can see how it moves memory between pools based upon the faulting rates.
For those using the performance adjuster, these memory charts can provide guidance on minimum and maximum memory pool sizes and pool priority that you can specify via WRKSHRPOOL (or the GUI interface). If you have pools with a lot of excess memory, you can specify a smaller maximum size to reduce the size of that pool. Likewise, if you have a pool that has very little unallocated memory, perhaps you need to adjust your tuning parameters so that particular memory pool can grow as needed.
If you’re manually tuning your memory pools, this information is also very useful for reviewing assigned pool sizes. Adjustments are easier when based upon actual metrics on how memory is used.
A few tips when using these charts:
- When displaying an entire collection (e.g., 24 hours of data), the bars in the Memory Usage by Pool and Memory Available by Pool charts will overlay each other. Zoom in to see the detailed bars for each memory pool.
- If you want to review memory usage for a pool for the entire collection, use the enhanced PDI feature to remove pools from the chart so you can focus on the specific information you want to review. That allows you to review a single pool for the entire day to get an understanding of its signature—look for highs and lows of usage as well as times when the usage metrics change.
- Sometimes it is helpful to display the charts using Classic PDI, particularly the Memory Usage by Pool and Memory Available by Pool charts. Classic PDI shows the narrow bars a little more clearly if you need to see information about all the pools in one chart without toggling off some of the pool data.
- Be sure to have the latest group PTFs installed as IBM has delivered some important updates for PDI.