Investigate IBM i Monitor Data Using the Performance Data Investigator
In this step-by-step tutorial, Dawn May explains how to use the Performance Data Investigator and highlights the differences between “investigate monitor data” and “visualize monitor data”
My blog, Getting Started with IBM i Navigator System Monitors, Revisited, explained how to set up system monitors in Navigator for i. Another blog, Visualize System Monitor Data, showed how to view monitor data in Navigator for i. This next post in the series reviews how to investigate monitor data using the Performance Data Investigator (PDI).
Investigating Data With the PDI
There are two ways to launch to PDI to investigate monitor data. The first is from the system monitor itself and the second is to start from Investigate Data then navigate to the Monitor package.
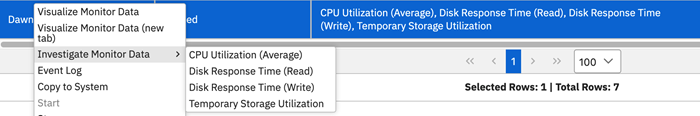
To start from a system monitor, right click on your monitor and find the Investigate Monitor Data option. Note that you can also select the monitor of choice and find the Investigate Monitor Data option in the Actions dropdown menu. You will find the option to drill down to metrics that have been defined in that system monitor, as the figure below shows.
After selecting the metric you want to investigate, you are taken to the Investigate Data task with the selected metric displayed for the current monitor collection. System monitor collections typically store data for one day, so you will be able to see the signature of that metric for the current day up to the current point in time.
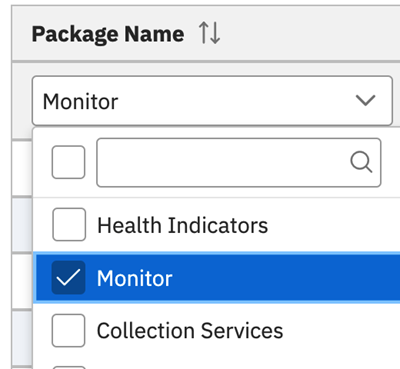
When starting directly from the Investigate Data task, you need to select the Monitor package name, as the following figure illustrates.
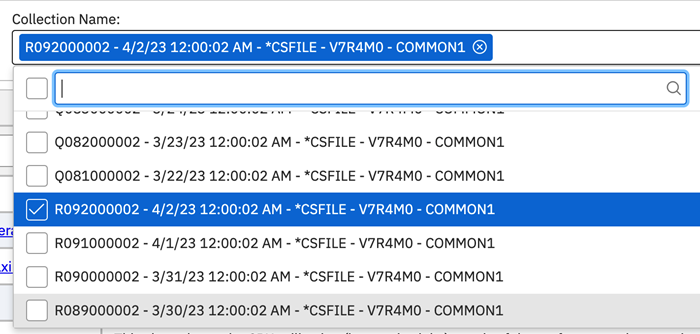
In addition, you need to select the system monitor collection to review; by default, PDI will select the most current “Q” collection—the default Collection Services collection. System monitor data is stored in “R” collections, so be sure to select the correct collection. The figure below shows that the “R” collections are near the bottom of the list.
Then, when starting from the Investigate Data task, select the Perspective you wish to review; the entire set of monitor metrics is available in the Monitor package.
The key differences between Investigate Monitor Data and Visualize Monitor Data are:
- Investigate Monitor Data allows you to review all available monitor metrics, not just the ones in the selected system monitor.
- Investigate Monitor Data allows you to drill down to other charts for a more detailed investigation into system performance. You can drill down into related monitor metrics, and you can also look into the traditional PDI charts to find top contributors in areas of concern.
- Investigate Monitor Data allows you to select the “R” monitor collection, which allows you to go backwards in time with any available “R” monitor collection. With the default retention setting, you can view the current collection as well as the prior 3 days of monitor data.
- Visualize Monitor Data updates in real time to display current metrics as they change.
- Visualize Monitor Data allows you to review all metrics for one monitor on a single display. Investigate Monitor Data, on the other hand, displays one metric at a time.
There’s even more to learn about system monitors; the next post will review how you can fine-tune your monitor data collection within the Configure Collection Services task.