IBM i Navigator System Monitors
Everyone should be proactively monitoring key metrics on IBM i. If you’re not already monitoring your system, I recommend getting started with IBM i System Monitors, which are included with Navigator for i. The feature article, Monitor Your IBM i Application and System Health, reviews why you should proactively monitor your system; this blog post shows you how to get started monitoring your system.
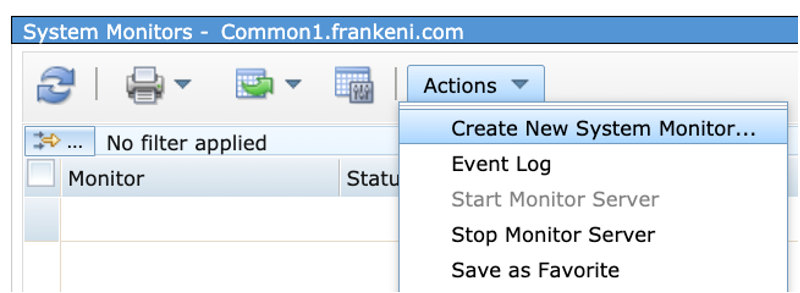
System Monitors are found in the left navigation tree under Monitors. Expand Monitors, then click on System Monitors to display the system monitors that have been created. If you haven’t yet created any system monitors, this list is empty. You create a new system monitor by clicking on the Actions drop down to select Create New System Monitor…. For a visual of this process, see Figure 1. Alternatively, expand All Tasks in the left navigation tree and select Create New System Monitor.
When you create a system monitor, you must give it a name. A description is optional, but it’s a good idea to be descriptive for both. When you click Next, you will be shown a list of monitor metrics to select from. Select the metrics you wish to include in your monitor and Add them to the list of Metrics to Monitor.
The list of metrics you can select from is a static list—you can’t define other metrics to monitor. This list includes the typical performance metrics that you would expect—CPU utilization, fault rates, disk response time, interactive response time and more. In addition to performance metrics, you can also monitor key system health metrics such as disk storage utilization, temporary storage utilization and spooled file creation rate. For a visual of this list, see Figure 2.
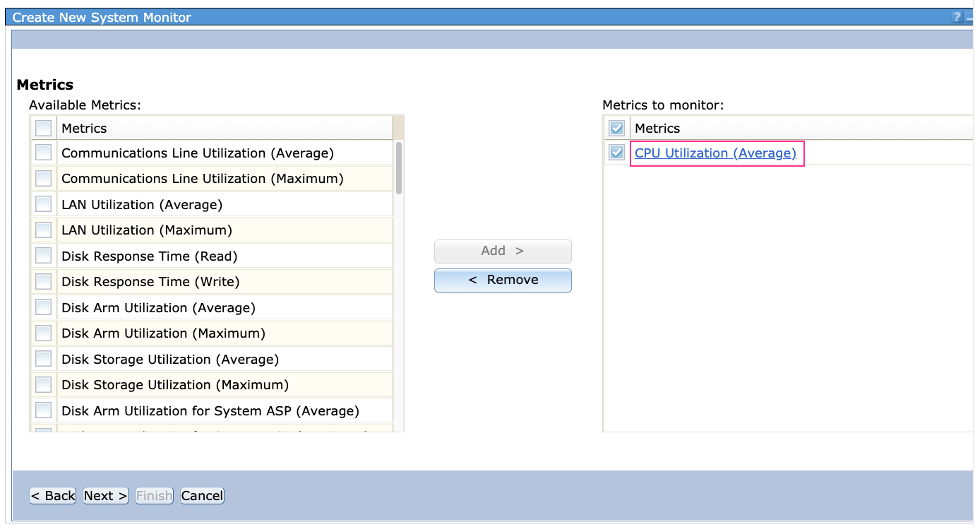
The next step is to configure thresholds and notifications. This is important as it allows you to specify values at which you want to be notified and what form that notification takes. To configure the metric, you click on the metric to monitor, which is a link to the properties of the metric. In Figure 2, above, the link to CPU utilization properties is outlined in pink.
Using CPU Utilization (Average) as an example, the Configure Metric panel looks like the screen capture seen in Figure 3:
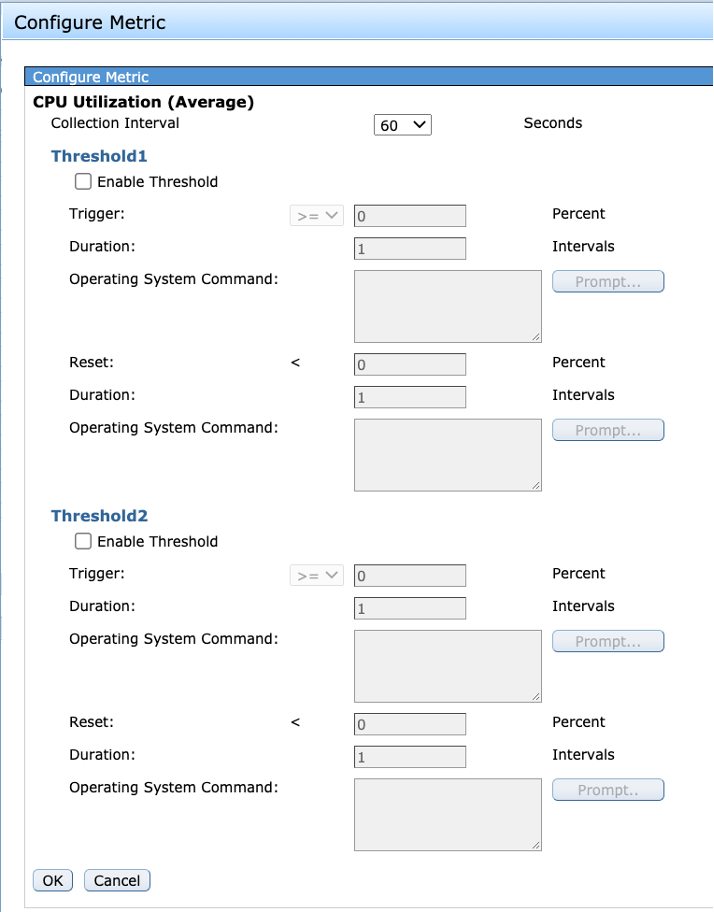
The first parameter is the Collection Interval—the default is 60 seconds and this is a good default. Use care in making this interval smaller as it increases the amount of data collected by the system.
Regardless of what metric you’re monitoring, you can define two thresholds. I think of these as warning and error thresholds, where warning is the point in which you want to be notified that the metric is above expected levels, and the error is the point in which action must be taken. Note that thresholds can also be used to identify the absence of something. For example, you could monitor for CPU utilization that’s too low in case something is not running. The Trigger threshold is when to notify you that the threshold has been exceeded; the Reset threshold defines when a situation is resolved.
The Duration setting is how many intervals (i.e., how long must the issue persist) before the notification is sent. For some metrics—CPU utilization is a good example—having a peak for one interval is probably not a concern, but if the issue persists for many intervals, then you want to know about it.
The Operating System Command is where you specify what action you want to take when the threshold is reached. It could be something simple like sending a message to QSYSOPR or sending an email message with SNDSMTPEMM. It can be a CALL to a program to take any action you want. IBM i System Monitors support replacement variables, which provides a way for the notification to include information about the monitor and the threshold that was reached.
After adding and configuring your metrics, you can complete the creation of your system monitor. The Summary panel will display each metric along with the trigger and reset threshold values. This panel doesn’t display the operating system command specified for each trigger; I’ve submitted an RFE to add that to the summary panel. If you think this is a valuable enhancement, vote for this RFE.
Once you’ve defined your system monitor, you need to start it. When the system monitor is active and thresholds are reached, you will automatically be notified via the operating system command you specified.
System monitors are automatically started after an IPL; if the monitor was active when the IPL occurred, it will be restarted once the IPL is complete.
There is much more to learn about System Monitors and you can read about them in IBM Documentation in System Monitors. The IBM Developer page also has a System & Message Monitors Overview.
Find links to blog posts on system monitors authored by me listed below:
- Copy a Monitor with Navigator for i
- System Monitoring for HTTP
- IBM i Monitors: Automatic Notification and Replacement Variables
- IBM i Navigator System Monitors: Collection Interval
- IBM i 7.3 System Monitor Enhancements
- New Monitor Metrics in 7.2
- IBM i 7.2 Navigator Monitors