Explore the Security Audit Journal With Navigator for i
Navigator for i, which I previously referred to as New Nav, is now simply called Navigator. I recommend using this version for most tasks. From now on, I will use the term Heritage Navigator when referencing Old Nav.
An exciting new feature is the ability to work with your security audit journal entries. Everyone should be using the audit journal to track key events on your system. The features of the audit journal are very rich and while you cannot audit everything, you should be using this in some form or another.
In the past, reviewing audit journal entries could be a tedious process. The green-screen user interface shipped with the system to review the journal entries was basic and the entry specific data needed to be deciphered. Third-party solutions appeared to help manage and review audit journal entries.
IBM provided the ability to access journal entries in general with the QSYS.Display_Journal table function. To make accessing audit journal entries easier, IBM has added specific services to retrieve audit journal entries. There is a nice set of audit journal entry services available and I anticipate IBM will continue to add more.
With Navigator, the hard work is done for you, and you now have a basic graphical user interface to review your audit journal entries. All you have to do is select the type of audit information and a timeframe for which to review.
You find the Audit Journal Entries task in the Security options, as Figure 1 shows.
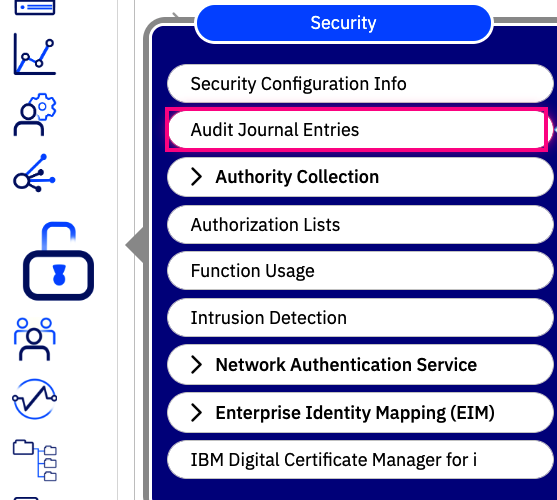
When you first take this task, you will be prompted with a View Configuration panel, where you select the criteria for the audit journal entries you want to view. Not all audit journal types are supported, but the most common ones are. Once you have selected your criteria, click OK.
Chart View
By default, you are presented with a dashboard that summarizes counts of the selected audit entries over the past day. You also have an option for a weekly view. With the weekly view you can customize beginning and ending dates and see the data over the selected period of time, which may be more than a week. Of course, a longer timeframe takes longer to display as there is more data for the underlying query to gather.
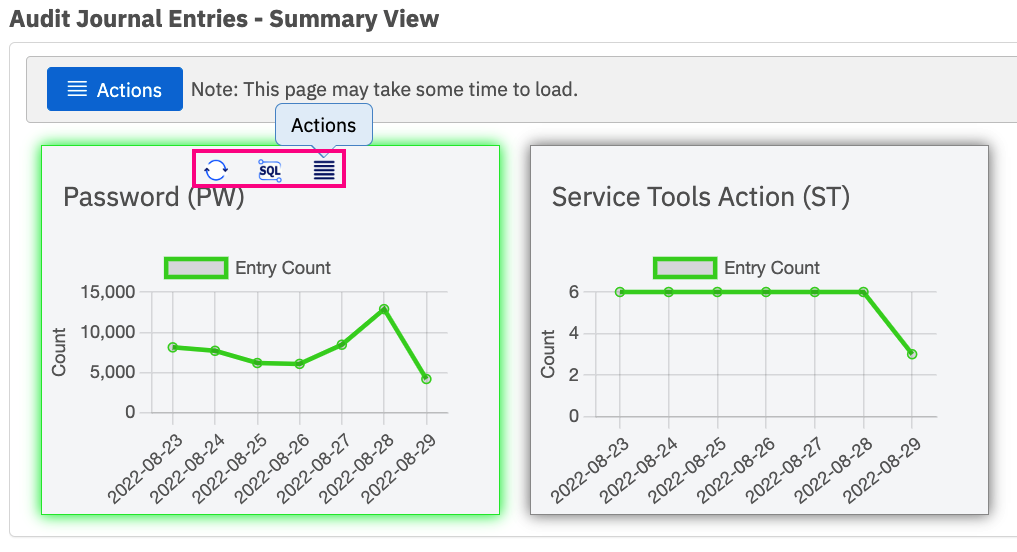
When you have selected more than one audit journal entry type and more than one day, each audit journal entry type will have its own chart. You can customize the chart color and refresh interval. Note that if you customize a chart, it applies to all charts displayed in the dashboard. When a chart has focus, it is highlighted. At the top of the active chart, you find options to manually refresh the chart, view the SQL that retrieves the data, or select from a list of actions. The list of actions can also be accessed simply by right-clicking on the chart. Figure 2 shows an example of summary charts for the past week.
The list of available actions can be seen in Figure 3.

Detailed View
The Detailed View action allows you to review the detailed information about the selected audit journal entry type. It’s nice that IBM provided an option to open the detailed view in a new tab so you can keep the summary view open as well. In the Detailed View, you can review the complete audit entry; use the Columns… dialog to select from an extensive list of available columns. The available columns vary by the type of audit journal entry you are reviewing. Use the column filters to find specific details of interest.
Within the Detailed View, you can select only one audit entry type and the timeframe defaults to one day. However, you can customize the timeframe. Again, a longer timeframe takes longer for the data to be displayed.
Whether in chart view or detailed view, the main Actions dropdown has additional actions, including one for Auditing Configuration, which provides a graphical user interface to select what actions you want to audit. This allows you to customize the actions that are audited. This is not a replacement for the auditing system values, but another interface to customize those settings. Using Navigator to review the auditing system values is also easier than setting them via the green screen.
Navigator for i is an essential management tool and I will continue to review new and enhanced features as they are released. If you have not yet started using (new) Navigator, do so today to take advantage of this valuable IBM i tool.