HTTP Server Statistics
Dawn May writes about four ways to access information about web performance.
The HTTP Server Statistics provide information on web server performance. There are four ways to access this information and I recommend investigating these metrics, especially if you’ve never looked at them before.
The first way to view them is through the IBM Web Administration for i GUI, where they are called “Real Time Server Statistics.” The Web Administration for i GUI shows these statistics as a snapshot in time for an active HTTP Server. In the Web Administration GUI, you need to Manage an active HTTP Server, then in the lower left frame, under Tools, you will find Real Time Server Statistics.

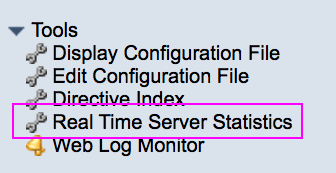
Click on the Real Time Server Statistics link to find a snapshot of the statistics displayed in the main frame, with several tabs revealing various metrics. You can manually refresh the statistics or set up an interval for automatically refreshing the data.
The relatively new IBM i Service, QSYS2.HTTP_SERVER_INFO also returns real time server statistics, but allows you to access this information without logging into the Web Administration GUI. Again, this is just a snapshot of the statistics for active HTTP Servers. An advantage of this service is viewing all statistics for all active HTTP servers at once, as opposed to the GUI where you can only review the statistics for one active HTTP server at a time. In addition, the service allows programmatic access to these statistics. Note that this service is only available on 7.3 and 7.4.
Collection Services collects HTTP Server statistics as part of the *STANDARDP collection profile, which is the default collection profile. These are the same real-time server statistics. During each collection interval, Collection Services harvests these statistics for each active web server. The nice thing with the Collection Services data is that it gives you the ability to look backwards in time to review this information. There are no charts in the Performance Data Investigator for these metrics, so you will have to use SQL to query the files directly.
Finally, Navigator System Monitors also collects HTTP server statistics. However, the visualization of these metrics is partition-wide, so if you have multiple web servers, the shows the peaks across all of the HTTP servers. However, monitoring the HTTP metrics can be useful if you know your typical peaks and want to be alerted if an unexpectedly high amount of web traffic hits your system. While the visualization is partition-wide, the underlying data in the system monitor database file does contain the full job name for the HTTP server jobs that recorded the peak values. It’s easy to access the raw data to get more information. Unlike many other system monitor metrics, you cannot view HTTP server statistics via graph history. The system monitor support for HTTP metrics is 7.3 and later.