How to Deploy a Simple Grafana Dashboard
In this step-by-step tutorial, Jesse Gorzinski explains how to deploy a Grafana backend on IBM i and connect to it from a Grafana container image
A “hidden gem” among IBM i’s open-source examples is a sample backend for Grafana. Grafana is a popular tool for monitoring various parts of your IT infrastructure. Its GitHub page describes it as “The open and composable observability and data visualization platform.”
In today’s exercise, we will deploy our sample Grafana backend on IBM i and connect to it from a Grafana container image.
Prerequisites
Before you get started, we’ll first need to install a few requisites. On IBM i, this means you’ll need Node.js (we will use version 18) and some tools to download a sample Grafana backend. You will also want to use SSH and make sure your SSH environment is set up properly, if you haven’t done so yet.
Assuming you have yum installed, you or your admin can install the needed software by running:
yum install ca-certificates-mozilla nodejs18 wget tar-gnu gzipAlternatively, one can install these packages with the Access Client Solutions tool.
You will need to install Docker or Podman on some other OS. For building a proof of concept, you can start with your local workstation. Both Podman and Docker are available for multiple platforms, but ensure you are following the license requirements. At the time of writing, Docker Desktop for Windows requires a fee-based license for use in some situations. In my case, I deployed Podman on a local Windows system by following these instructions.
Now that you have a container engine and the IBM i requirements installed, you’re ready to proceed!
Deploy Grafana Backend on IBM i
In today’s exercise, we will deploy the sample Grafana backend published in our IBM i open-source examples repository.
First, decide where to install the Grafana backend. In this case, I will install it to /opt/grafana. Then, just “cd”’ to that directory, download the IBM i open-source examples repository, and extract the sample code using the following steps:
mkdir -p /opt/grafana
cd /opt/grafana
wget https://github.com/IBM/ibmi-oss-examples/archive/refs/heads/master.tar.gz
tar -xzvf master.tar.gz --strip-components=3 ibmi-oss-examples-master/nodejs/grafana-backend
Let’s pause for a second and review what we did on that “tar” command:
- -xzvf specifies the operations that we’re asking tar to do:
- “x” means extract
- “z” means to perform gzip decompression
- “v” means to be verbose, because visual feedback is nice
- “f” means we’re operating on a file
- master.tar.gz is the file that we’re extracting
- –strip-components=3 tells tar to remove the first three directories from the path when extracting. In this case, the sample code is located in the ibmi-oss-examples-master/nodejs/grafana-backend directory inside the tar file, but we want to discard that path when we extract it.
- ibmi-oss-examples-master/nodejs/grafana-backend is the directory we want to extract
At this point, you’ve downloaded the sample backend and extracted the contents. Now you can proceed to install the npm packages needed to run the sample:
/QOpenSys/pkgs/lib/nodejs18/bin/npm installAnd now you’re ready to launch!
/QOpenSys/pkgs/lib/nodejs18/bin/node indexBy default, the server will run on port 3333, and you should see a success message:

If you can’t use port 3333, you can use the PORT environment variable. For instance:
export PORT=9333At this point, you have your Grafana backend listening on your IBM i system, ready to serve up data!
Deploy Grafana Server in Podman or Docker
Next, download the official open-source image from Docker Hub by running:
docker pull grafana/grafana-ossOr if using Podman:
podman pull docker.io/grafana/grafana-ossAnd now to launch the image in a container named “Grafana:”
docker run -d –name=grafana -p 3000:3000 grafana/grafana-oss
Or for podman:
podman run -d --name=grafana -p 3000:3000 grafana/grafana-ossThat’s it! Now you can point your browser to http://localhost:3000 and access the Grafana interface.
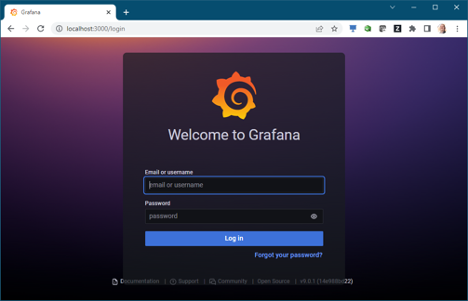
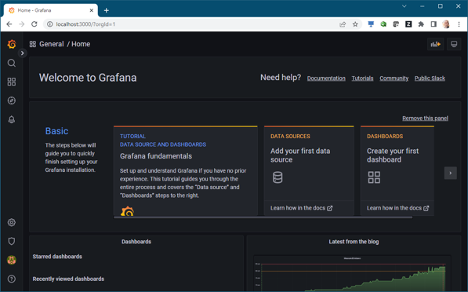
The default password for the “admin” username is “admin.” When you log in with this default password, you will be prompted to change it to something more secure. You’ll then be brought to the Grafana home page. That’s it! You’re running Grafana!
Install SimpleJson Plugin
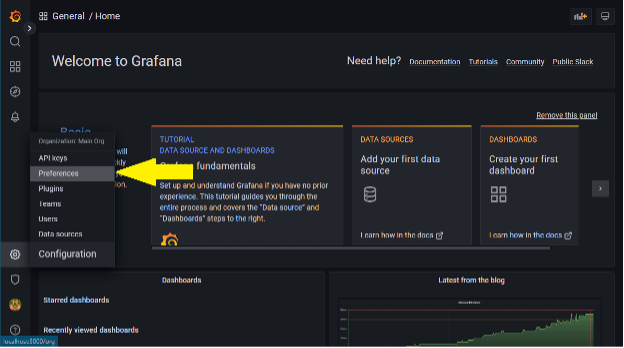
To install a plugin, just find the “Settings” button (a gear icon) on the left-hand pane and go to “Plugins.”
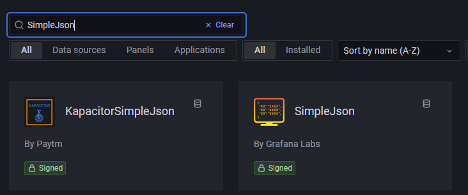
Search for “SimpleJson” and install the SimpleJson plugin from Grafana Labs (ignore other results, such as KapacitorSimpleJson).
Add a Data Source
Now, you will add your IBM i backend as a data source. To do so, go to Grafana configurations and find the “Data sources” option. Click the button to add a data source.
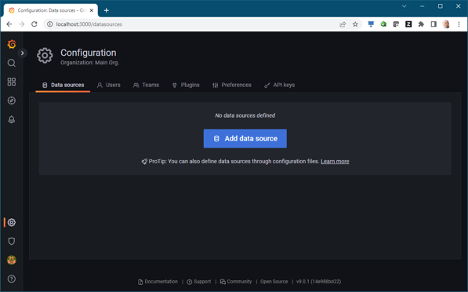
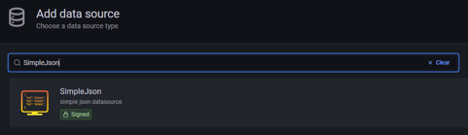
You will be shown a list of data source types. Search for SimpleJson and choose that option.
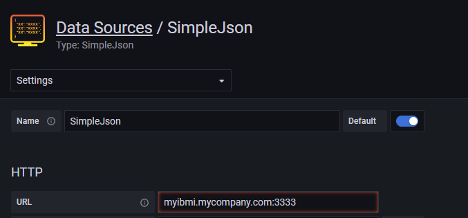
For your new data source, you leave the name as the default “SimpleJson” or give it something more descriptive. For the URL, just put your IBM i hostname and port (3333 if you are running the backend on the default port) in hostname:port format. For instance, myibmi.mycompany.com:3000. Click “Save and Test” to verify that Grafana can talk to your backend.
Install the Sample Dashboard
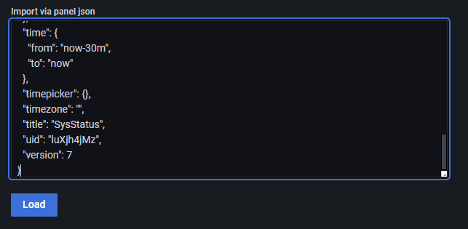
At this point, you have Grafana talking to your IBM i system! So, let’s start visualizing data. Click the Dashboards button on the left-hand navigation pane (looks like four small squares) and click the “import” button.
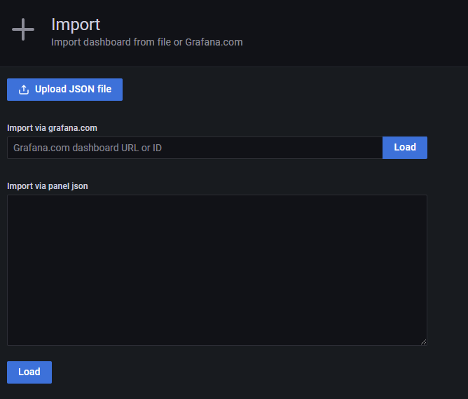
We include a sample dashboard in the grafana example alongside the backend code. You can open a new browser window and go straight to the JSON representation through this link. Simply copy and paste that into the “Import via panel json” field and click “Load.”
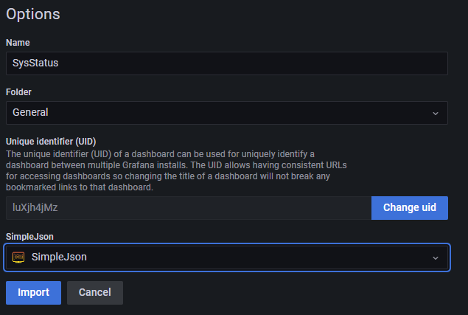
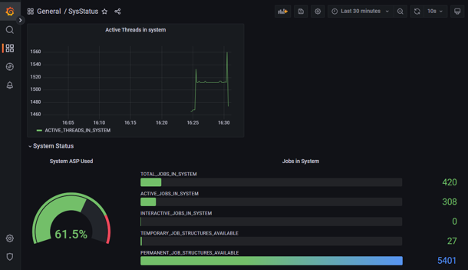
The next screen will allow you to choose your IBM i (SimpleJson) data source.
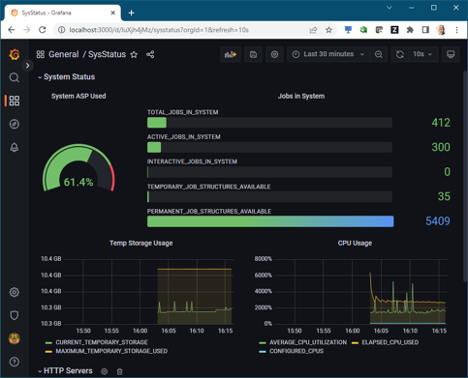
And now you’re visualizing live data from your IBM i system. Note that the HTTP server metrics are only available if you have the proper fix level for QSYS2.HTTP_SERVER_INFO as documented here.
Add Your Own Metrics
The sample Grafana backend provides numerous system attributes, and the provided sample dashboard doesn’t visualize all of them. Let’s add a new panel. Start by finding the “New panel” option.
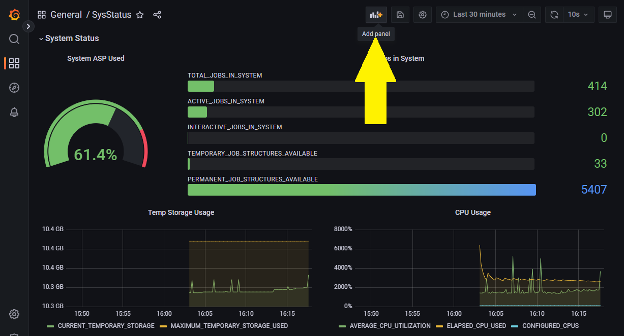
Choose “Add a New Panel.” There are plenty of options for you to play around with here, but let’s create a new timeseries graph for the number of active threads. The query definition would look something like this:
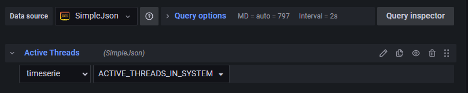
And just like that, I’m monitoring active threads!
What if the sample backend isn’t exposing the metrics you want? No worries! Just head over to the project README. By editing a YAML-based configuration file it’s relatively easy to add your own queries to the backend, which can then be visualized in Grafana. That could mean more IBM i services or information about your business operations, like real-time sales numbers.
What Next?
Today’s exercise set up a simple dashboard for monitoring a single system. If you have multiple systems, you can add extra data sources, allowing you to deploy multiple dashboards or a single dashboard monitoring multiple systems.
In my next blog post, I will show you how to integrate your system with Prometheus, another popular solution used for monitoring IT infrastructure. Prometheus delivers a timeseries database to keep track of historical data and is often paired with Grafana for dashboards and visualization. Prometheus also has integrations with other monitoring tools like DataDog, Nagios, IBM Instana and plenty more.