Navigator for i Graph History: Enable Historical Data Collection
IBM i expert Dawn May continues her series about Navigator for i by discussing historical data.
Collection Services gathers performance data on an ongoing basis. By default, there is one collection each day; it’s quite easy to review that data with the performance data investigator. Looking at your performance data on an ongoing basis is a good practice and helps you understand your day-to-day performance signature.
However, it is also very important to understand your performance trends over a long period of time – weeks, months, and even years. You may not notice an increase in average CPU utilization when viewed on a daily basis, but if you can see the average CPU utilization over the course of weeks or months, you may discover trends you would otherwise miss.
The 7.3 release introduced historical data and Graph History, enabling long term system data collection. In my work with many IBM i shops, not one had enabled this feature. This blog reviews how to enable historical data collection.
First, enable Collection Services to create historical data. This is done via the Configure Collection Services graphical interface in Navigator for i (or CFGPFRCOL for those who like commands). Configure Collection Services is found under Performance; you simply need to turn on the Create historical data when collection is cycled option, as shown the following figure:
Next, determine how long you want to retain the historical data, which is specified on the Data Retention tab. The retention options depend upon whether the PM Agent is running. Without turning on the PM Agent, you are very limited in the length of time you can save historical data; turning on the PM Agent allows you to save summarized historical data for up to 50 years. In general, I think keeping 3 years of summarized data is a good choice. I also recommend 30 days of detailed historical data.
Note that you only need to have the PM Agent running, you are not required to send your performance data to IBM.
There are further configuration options on the Historical Data tab, including what interval you want for your historical data and how many top contributors you want to save.
Once you enable historical data collection, the system will automatically summarize the daily performance data when collection services is cycled, which is typically at midnight. When historical data is created, Collection Services reduces and summarizes data the data from the management collection object. This data resides in library QPFRHIST. Like all other Collection Services Db2 files, the files that are used to store historical data are documented in the Knowledge Center.
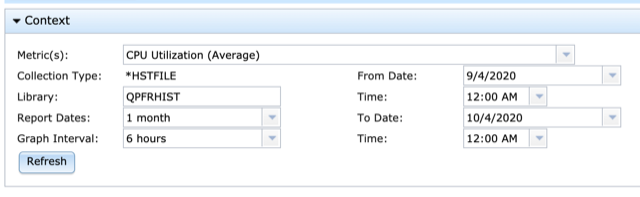
Graph History is the user interface to view your historical data. It is found under the performance tasks in Navigator for i. When you open a Graph History summary chart, it shows you the system’s CPU Utilization trend. There are many other metrics that you can review so expect future blogs about using Graph History.
There is much more to know about historical data and Graph History. Thankfully, there are many online resources, which are listed below:
- Graph History in IBM i Technology Updates
- A new way to analyze historical performance data on IBM i
- Graph History in the Knowledge Center
- Graph History – Stacked Charts
- Graph History – New in 7.3 IBM Navigator for i
- RFE: Collection Services Historical Data Should be created by default