Monitoring Tools for Power Systems and AIX
Monitoring tools improve service availability and productivity by proactively identifying, diagnosing and repairing slow or otherwise unstable connections. On the other hand, management tools ensure that your system is available, configured properly and its components are connected correctly and as expected, whereas monitoring tools look for overall system, communication, and application performance impacts. For above-mentioned reasons, management and monitoring tools are requirements for Power Systems and AIX environments.
Different monitoring tools can be used for Power Systems and AIX. There are a lot of tools out there to monitor Power Systems. Each of them have primary benefits associated with them. In this article, you’ll learn what to consider when identifying what the most beneficial tool might be for your environment and requirements.
HMC GUI PCM
The first tool I’ll talk about is the HMC performance and capacity monitoring (PCM). This tool works with all Power Systems since version 7 and Firmware 780. It’s easy to use. The only thing you’ll need to do before anything else is to start the performance data collection for each Power System you want to monitor. This tool allows you to monitor not only performance for each LPAR, but also PowerVM utilization metrics, such as I/O and network metrics.
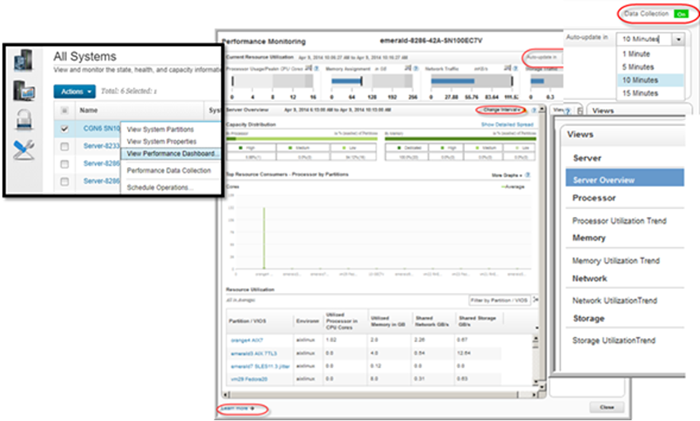
Figure 1, above, is the server overview. This view displays the current and general situation for that Power System. The upper part of the view displays the total CPU, the memory, I/O and network resources consumption. At the middle part, we get LPARs with highest CPU consumption. At the bottom part, there is a table with averages, minimum and maximums for each LPAR. In general, this is the overall situation for that server and its LPARs.
Topas CEC View: Real-Time Monitor per Server
Now, let’s talk about the Topas Cross partition view (CEC View), also known as whole machine view. This tool allows us to view in real time different performance metrics for VIOS and AIX LPARs running in the same Power System. In order to use it, you just have to type topas -C in the command line of any LPAR in the system and then you’ll get a similar view as seen in figure 2:
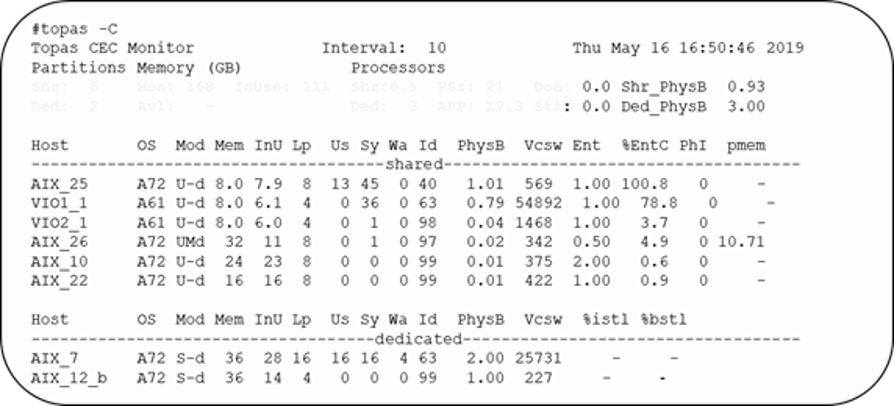
For example, topas -C displays the total memory allocation for each LPAR, real memory and CPU consumption in real time and so on. This is real-time information for all LPARs running in the same Power System hardware.
Keep in mind the following considerations for using Topas CEC View:
- All the LPARS must be running in the same hardware and the same subnet.
- Make sure all LPARS are running xmtopas
- Check the /etc/inted.conf file and keep the following line uncommented: xmquery dgram udp6 wait root /usr/bin/xmtopas xmtopas -p9
- Then check the subsystems running under the inetd services with lssrc –ls inetd
Topas Cluster View: Real-Time Monitor per Data Center
The Topas Cluster view is similar to the Topas CEC view in the sense that both give the same information. But the main difference of Topas Cluster View is that it allows us to see what’s happening in all the LPARs, no matter their physical location. Therefore, we can get the total resource consumption for the entire AIX farm.
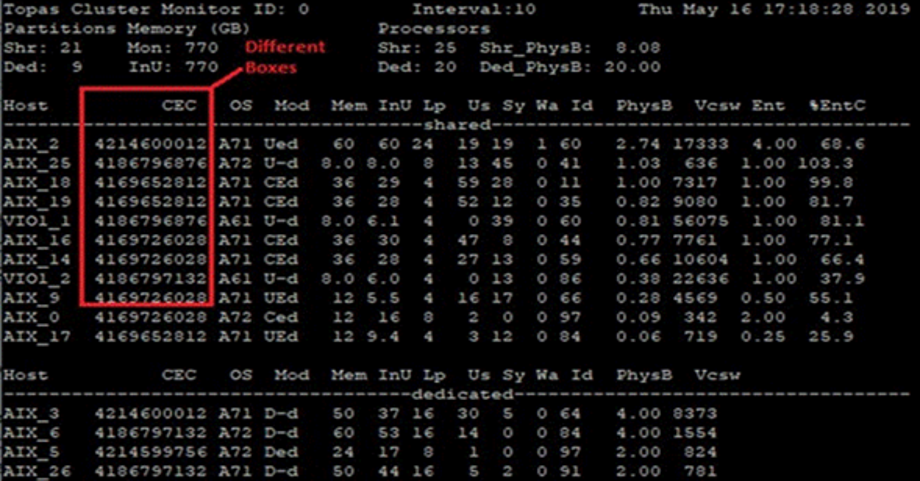
For example, as seen in figure 3, all the Power Systems are consuming 800G of memory, there are 25 allocated processors, but only eight of them are being in used. In addition, we have detailed statistics for each LPAR. This is a nice tool, because it allows us to get the total picture in real time of the entire data center for AIX.
NMONVisualizer
The NMONVisualizer is a Java GUI for analyzing nmon, iostat output files, Perfmon CSV data and JSON data, inter alia. This tool generates reports very similar to nmon. But its main advantage is its processing speed. For instance, if you need to process a lot of nmon files and the process is taking a plenty of time. This tool will help you with that, because it’s a Java application.
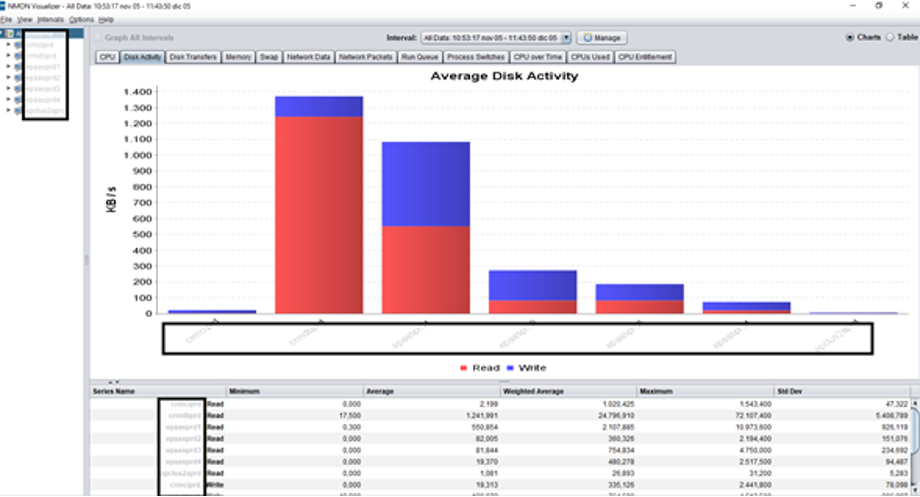
This tool provides the same metrics and graphics than nmon with aggregated and detailed metrics and tables with averages, minimums, and maximums (see figure 4, above). The tool can be downloaded for free at this website.
Freeware Tools: Nagios Core
Nagios is a free tool to monitor the whole data center—from switches, to devices, to applications and OSes including AIX. The default configuration of Nagios is limited. Therefore, you’ll need to install different add-ons to expand its initial capabilities. For example, the np4Nagios produces nice graphics with performance data. The NPRE is a plugin which allows you monitor any device or OS using shell scripts.
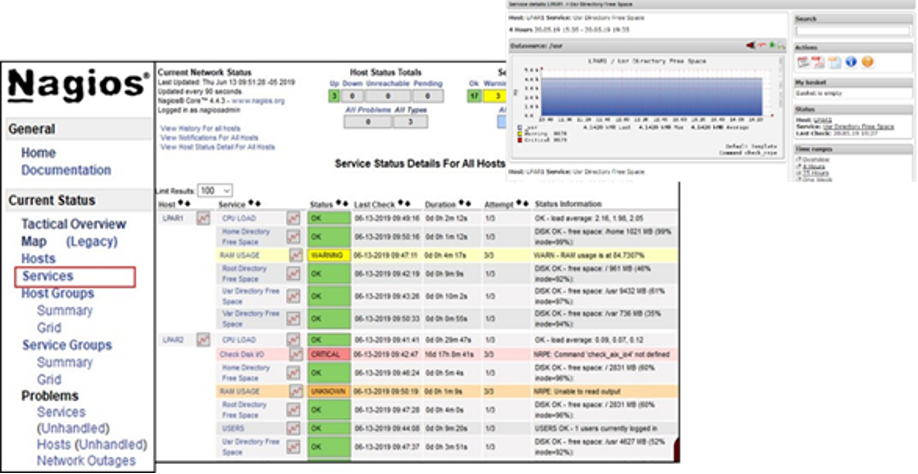
Figure 5 shows the services view. This view displays different messages for each service. In addition, it exhibits performance graphics using the np4nagios addon. In general, Nagios is designed for support desk personnel, since it only reports simple messages such as CRITICAL, WARNING and OK.
Freeware Tools: Ganglia
Ganglia is other popular tool to monitor data centers, applications and OSes, including AIX. The Ganglia server can be installed in AIX; it scales well with very large numbers of servers and shows any performance metrics in near real time. Ganglia provides different hierarchy views. These views are grids which represent data centers, clusters correspond to the Power Systems servers and nodes are the LPARs.
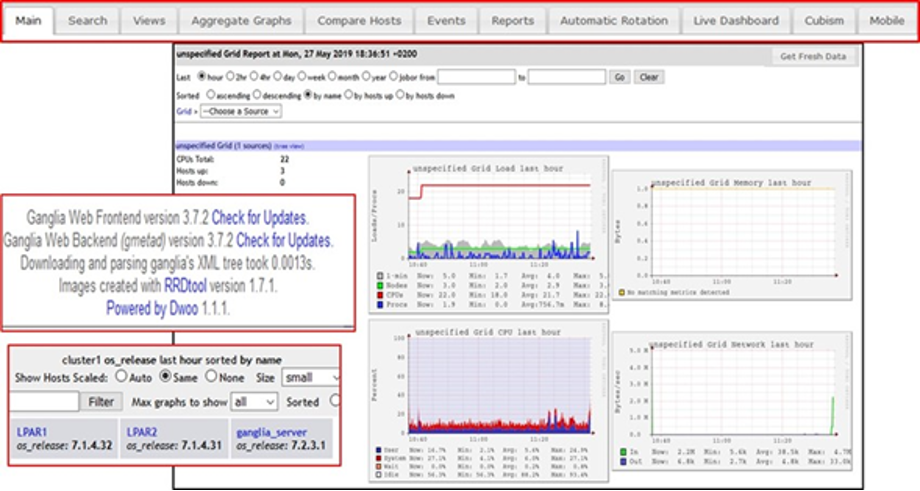
The tool also exhibits aggregated view of performance graphs for all LPARs in the same hardware in real time. However, you need to organize the nodes (LPARs) sharing the same hardware into clusters. Figure 6 shows the grid view and different AIX being monitored. Finally, Ganglia can monitor every aspect of AIX, since it offers the gmetric command which allows to create custom metric to monitor any resource.
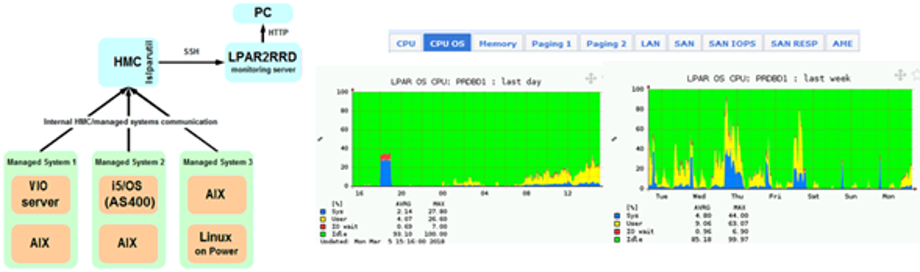
Freeware Tools: LPAR2RRd
The LPAR2RRD is a free application, designed from ground-up to monitor Power Systems with AIX, IBM i, Linux, etc. You can download it for free and the server can be installed in AIX. The LPAR2RRD server connects to the HMC and gathers information about the CPU consumption. But, if you install a simple agent on each LPAR you’ll get more detailed information about performance. As you can see in the figure 7, you can get information about memory, paging activity, ethernet and SAN performance, for each LPAR:
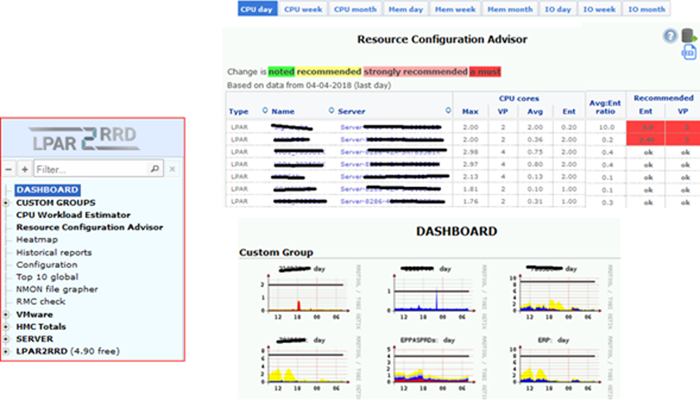
The best thing about LPAR2RRD is the Resource Configuration Advisor. This function gives the different recommendations about performance configuration. For instance, in figure 8, the tool is suggesting increase of CPU resources for some LPARs. In addition, there are resource recommendations for memory, ethernet, IO and so on.
Enterprise Tool for Power Systems: IBM Tivoli Monitoring
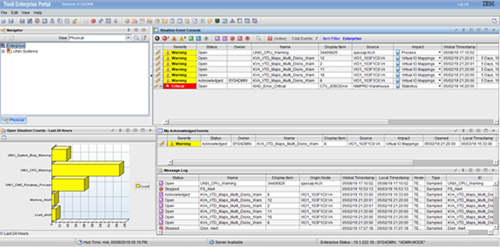
IBM Tivoli Monitoring (ITM) is an enterprise monitoring tool that monitors systems, devices and applications on different OSes and tracks the availability and performance of your systems, including AIX and PowerVM with out-of-the-box reports to track trends and troubleshoot problems. The dashboards are highly customizable; therefore, with an intuitive interface, users can quickly assess the current situation for PowerVM, AIX and applications (see figure 9).
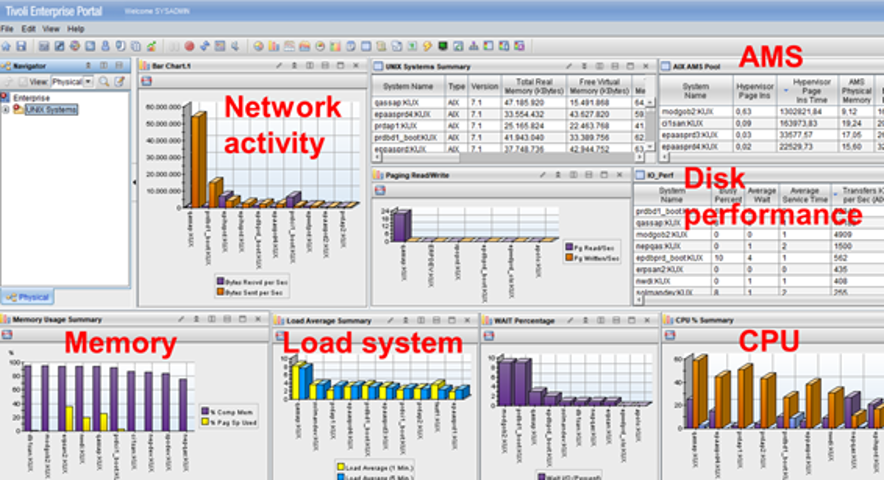
In addition, ITM provides unified real-time and historical views of the Power System environment and allows you trigger actions such as sending alert emails when something wrong happens (even at application level).
ITM can monitor not only AIX, but also applications, switches, storage servers and so on. ITM V6.3 licenses are included with AIX Enterprise and Cloud Editions. However, it can also be ordered as a separate product.
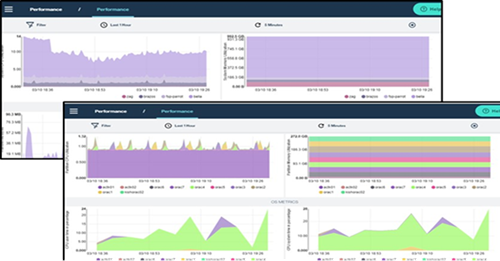
IBM Cloud Management Console for Power Systems
IBM Cloud Management Console for Power Systems (CMC) is unique in the sense that is a monitoring solution running in the cloud. This application deals with customers which have a lot of different HMC. It connects to them and gathers performance metrics for servers and LPARs. A 36-month subscription is also included in Power Systems Enterprise Cloud Edition with AIX or with purchase of any new enterprise server (see figure 11).
What’s Next?
Explaining all of the monitoring tools available for AIX and Power Systems is beyond one article. There are other interesting tools that you can look into such as HMCScanner, Zabbix, Solarwinds, Galileo, Robot Monitor, among others. In my next article, I’ll discuss the different management and performance tools for AIX and Power Systems.