Active Prestart Jobs in New Navigator
With New Nav, you have a graphical user interface and you no longer need to craft your own queries to get at the data. Learn the benefits from Dawn May here.
It’s important that you review and tune your prestart job configuration settings for optimal performance. In the past, this was a bit tedious as you had to use the Display Active Prestart Jobs (DSPACTPJ) command to display the statistics for each prestart job entry. With the addition of the IBM i services for prestart jobs, this became much easier, since you could use the QSYS2.PRESTART_JOB_INFO and the QSYS2.PRESTART_JOB_STATISTICS services to easily retrieve information about active prestart job entries and their statistics.
IBM provides an example service, Prestart jobs statistical review, in Run SQL scripts so you don’t have to craft the query yourself. (Note: there is an error in the example where “active” is not a valid column (where active = ‘YES’). You need to replace “active” with subsystem_active. I like to expand this example to also include the prestart job tuning parameters (INLJOBS, THRESHOLD and ADLJOBS), so they can be reviewed in conjunction with the statistics.
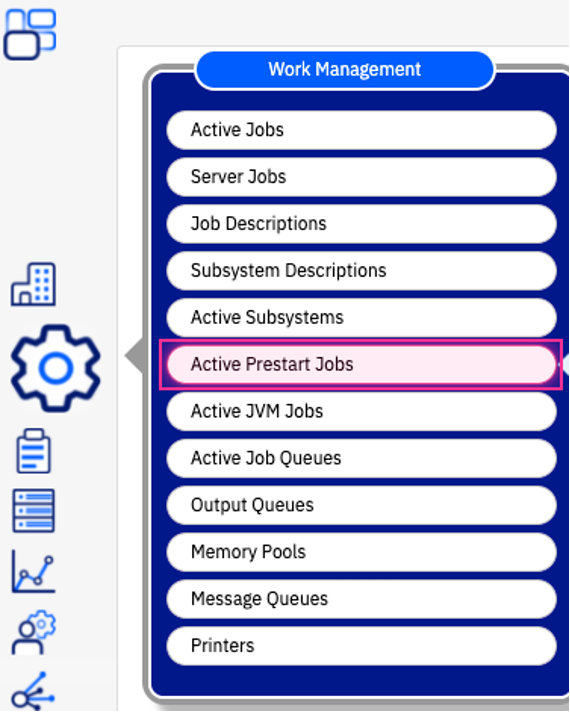
Now, with New Nav, you have a graphical user interface to provide this information and you no longer need to craft your own queries to get at the data. Find active prestart jobs under the Work Management task, as the figure 1 shows:
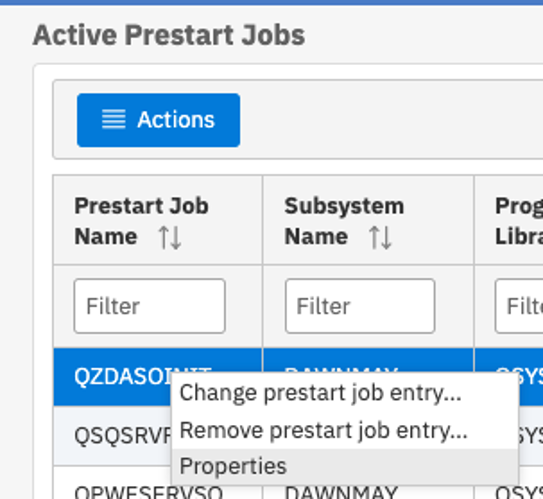
This will return a table with one row for each active prestart job entry in all active subsystems on the partition. You can use the various filters to limit the results to only specific subsystems or prestart job entries. This allows you to review all the statistics for prestart jobs in one table. With a simple right-click you can change, remove or view the properties of the prestart job entry. Properties (see figure 2) displays all the statistics for that prestart job entry, which is a superset of the statistics that are displayed in the table (you can add the additional columns of information to the table).
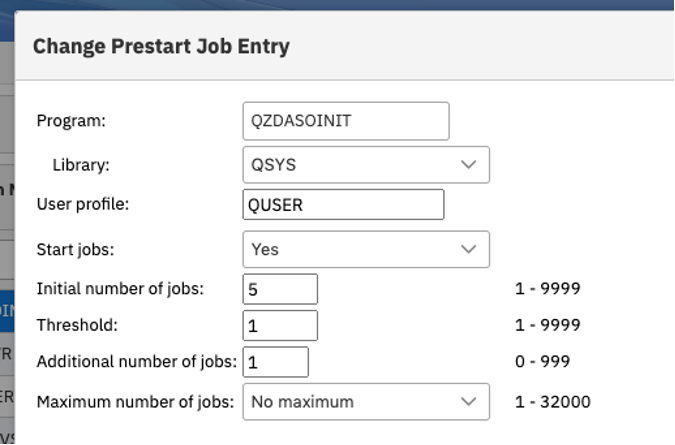
If you want to review the tuning parameters, you need to select the Change prestart job entry… option, which displays the CHGPJE command in the GUI (see figure 3):
This support is very nice; however as I noted above, I like to display the tuning parameters in the results along with the statistics.