SPLAT: The Simple Performance Lock Analysis Tool
Understanding locking activity and how it affects the performance of databases, applications and the OS itself is an essential part of every AIX specialist's diagnostic arsenal.
I don’t know about you, but locks give me a headache. The way locking activity is implemented and the myriad types of “stuff” locks do and affect is, quite simply, mind-boggling.
However, locks are something we’ll likely always have to deal with, which makes understanding locking activity and how it affects the performance of databases, applications and the operating system itself an essential part of every AIX specialist’s diagnostic arsenal. Fortunately, the complex topic of locking can be boiled down to a few easy to understand concepts.
So what is a lock? In computer programming, a lock is a synchronization mechanism. Locks enforce limits on access to shared resources when lots of threads are seeking that access. Think about a database. The whole reason any database exists, basically, is so data can be read from or written to it. Now what happens when you have a whole bunch of working threads that simultaneously require read or write access to your database? That’s simple: Without a robust locking mechanism, your database would crash a lot, to the point where you’d have a hard time getting any useful data from it. Locks allow some threads to access data while making the others wait for that access. Locks serialize access to data in an orderly fashion, parsing out access times and types proper to the type of thread making the request.
As you read on, please understand that I’m purposefully omitting a great deal of information, mostly because a course on programmatic locking is beyond the scope of this article. Also, I want to do something different. You’ve no doubt read a few locking articles previously. They typically list dozens of terms, but too often fail to explain any of them. With this in mind, I’ll share the basics of implementing the Simple Performance Lock Analysis Tool, or SPLAT. It’s really the only game in town when you want to examine locking activity in your AIX system. To present its information, SPLAT uses only about a dozen different terms. And this is a good thing. Once you get the hang of these oft-repeated terms, you’ll be able to quickly do a basic read of lock activity in any AIX system.
Examining Lock Data
In most operating systems, locking can be categorized into two main types: simple and complex. There are sub-types and hybrids, but these are the two you will see the most. Complex locks are read/write locks that protect shared resources like data structures, peripheral devices and network connections. These shared structures are commonly referred to as critical sections, and bad things can happen if strict rules about accessing critical sections aren’t observed. Complex locks are “pre-emptible” and non-recursive by default, meaning they cannot be acquired in exclusive-write mode multiple times by a single thread. However, complex locks can become recursive in AIX by way of the lock_set_recursive kernel service. Complex locks are not spin locks – meaning they will not enter into a loop and wait forever for a lock to be acquired. At some point, they will be put to sleep. Then we have the simple lock. Simple locks are exclusive-write, non-recursive locks that are also pre-emptible and protect critical sections. Simple locks are spin locks; they will wait – or spin – to acquire a lock either until they acquire that lock, or some threshold is crossed. In AIX, this threshold can be controlled using the SCHEDO tunable, maxspin.
Now let’s look at some lock data. SPLAT data is extracted from a raw lock trace file. But if you want to use the SPLAT, some prep work is needed. First, you need to tell the trace utility to examine locking activity, and only locking activity. At one time, lock tracing could only be enabled by doing a special form of bosboot and then rebooting the system. In fact, some purists still recommend this. But these days, all you really have to do is enable lock tracing from a root command prompt.
(A quick aside: You can get some lock data from a kernel trace… but only some. If you use SPLAT to extract locking activity from a regular kernel trace file, you’ll wind up with only about 10 percent of what you need to diagnose locking problems with any degree of reliability.)
Here’s the command to enable locking tracing. Again, do this as root:
locktrace -S
Now run a trace. You can use this syntax, or any other trace syntax that you’re comfortable with:
trace -a -fn -o locktrace.raw
-T20M -L40M ; sleep 5 ; trcstop
Really, the syntax doesn’t matter – though I would recommend that you don’t omit any hooks. Incidentally, during its usual course of execution, PerfPMR will run a locktrace on every logical processor in your system. PerfPMR will also handle turning lock tracing on and off, greatly simplifying lock activity data collection.
At this point, if you convert the locktrace.raw file to ASCII using the trcrpt command, you’ll see quite a difference in the output from a normal kernel trace; the data will only show locking activity. Now you can put all this lock data into a more easily readable report with SPLAT:
splat -i locktrace.raw -n gensyms.out -da -sa -o splat.all
SPLAT includes many flags; the above command includes those I find most useful. And remember: You need a gensyms file created with a gensyms > gensyms.out to make everything readable.
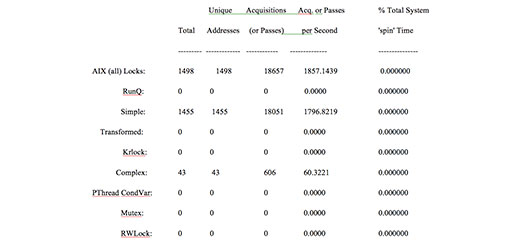
You now have a comprehensive lock activity report called splat.all. This first part of your SPLAT report will list the types of locks that were held in your system during the time you ran your trace. In addition to complex and simple locks, SPLAT lists counters for several other types of locks. These can be disregarded for now, although I want to make a point about kernel locks. If you’ve ever opened a PMR with IBM about setting your virtual memory options (VMOs) properly, doubtless you’ve heard quite a bit about kernel locks. Every lock in any UNIX system is a type of kernel lock; no locking activity happens without the express permission of the operating system. So don’t be confused when you see complex, simple and kernel locks broken out in the SPLAT report. They’re all kernel locks.
See Figure 1 below (click to view larger) for a sample of this section in the SPLAT report.

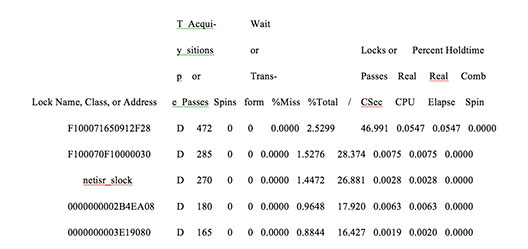
The next section of the SPLAT report presents the ten system locks that consume the most resources. Also included are various timings for a number of counters: the lock name, the class or address, the lock type (simple, complex, etc.), how many times the lock was acquired or spun, and the amount of CPU time that was spent handling the lock. That last counter is where you’ll look first in your lock performance evaluation. Every now and then, for whatever reason, a lock will consume way more CPU than it should. When this happens, you should check the lock detail to see which thread is responsible for holding the lock. If it’s a database thread, your database vendor can probably provide a patch for it. If it’s an application thread, and high CPU consumption by locking activity occurs repeatedly, you’ll need a code review.
See Figure 2 below for a sample of that section.

Among other things, SPLAT also presents individual sections about locks held by kernel threads and functions.
Other Lock Types
To reiterate, your early performance evaluations of locking activity in AIX should focus on the complex and simple locks, since these will be the lock types that most commonly affect system performance. But don’t ignore the other lock types. Here’s a list of the alphabetic designators SPLAT uses to identify those locks. You’ll want to know the different types for your record-keeping:
Note that in the sample SPLAT report referenced above, the lock type is identified as a disabled simple kernel lock (D).
If you’re unfamiliar with many of the terms presented by SPLAT, you can read the man page for a complete lists of definitions. Here are a few that I consider essential:
- Acquisition – The number of successful lock attempts any lock carried out.
- Spin – The number of unsuccessful lock attempts any lock tried.
- Wait or transform – The number of unsuccessful lock attempts that resulted in the thread that attempted the lock being put to sleep to wait for the lock to become available, or allocating a kernel lock (see the recursive vs. non-recursive lock definitions above).
- Miss rate – The number of unsuccessful lock attempts divided by acquisitions, multiplied by 100.
Creating a SPLAT Report
One of the easiest ways to create a good SPLAT report is to generate heavy I/O network and storage traffic. Go onto your NIM server and start a NIM mksysb backup. While the backup is running, take a locktrace (remember to both enable and disable lock tracing with the locktrace –S and –R commands), or simply run PerfPMR. While that’s running, go onto the NIM client you’re backing up and do the same thing. Do you notice a difference in your SPLAT reports? You could also FTP, RCP or create dummy files. Basically, anything that generates heavy network and storage activity will yield good SPLAT information.
Once you’ve completed your SPLAT report, don’t forget to disable lock tracing (locktrace -R). To check whether lock tracing is enabled on your system, use locktrace -l.
SPLAT is invaluable in determining if locking activity is holding up processing: spins, acquisitions, miss rates, the amount of CPU consumed…. the list goes on, and they’re all spelled out in the SPLAT report. Once you use it a few times, I’m sure you’ll see the benefits of making SPLAT a part of your performance diagnostic arsenal.