Workload Groups and Performance Considerations
How to understand possible performance implications when using workload groups.
I’ve written about workload groups in the past in Workload Group Configuration with IBM i 7.3 and i Can Manage Workloads better with IBM i 7.1. This blog reviews how to understand possible performance implications when using workload groups.
Imagine a scenario using workload groups to limit your IBM MQ environment to a single core on a partition with six cores; your motivation is to reduce your licensing costs. But what if MQ requires more than one core? How can you determine if the workload is constrained?
In order to show you the performance graphs related to workload groups, I ran a test where the work was limited by a workload group. I configured my own subsystem – DAWNMAYSBS – and set it up so everything ran in that subsystem: my interactive sessions, prestart jobs running on my behalf (routed there by the SET_SERVER_SBS_ROUTING service) and my FTP requests.
I added a workload group named DAWNMAY with a processor limit of 1 and changed my subsystem description to use this workload group. All the work I’m running in DAWNMAYSBS subsystem will be limited to a single core.
For my test workload, I created a simple CL program that looped endlessly running a DSPOBJD of all objects in all libraries to an output file and submitted that to five batch jobs. I used RunSQL Scripts from ACS to generate a long-running query that ran in a prestart job in my subsystem; then I initiated an FTP of a 3GB save file. All of this ran in my single subsystem constrained to a single core.
While this example is contrived due to my limited test environment, the performance data from this test demonstrates how you can determine if your performance is restricted by a workload group.
Collection Services collects workload group performance metrics. The Performance Data Investigator provides graphs for workload groups; you have everything at your fingertips to review the performance data.
Let’s take a look at the Workload Group Charts in PDI.
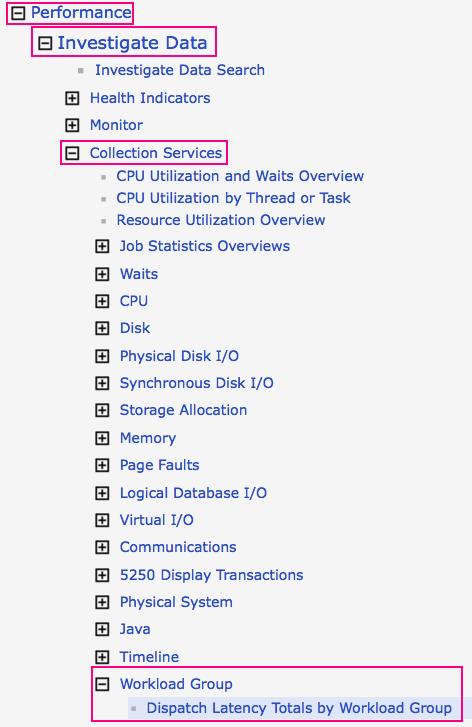
You’ll find the navigation to the Workload Group charts within PDI in the screen capture below. There’s a single chart from which to start, Dispatch Latency Totals by Workload Group.
Here is what I saw when I displayed that chart:
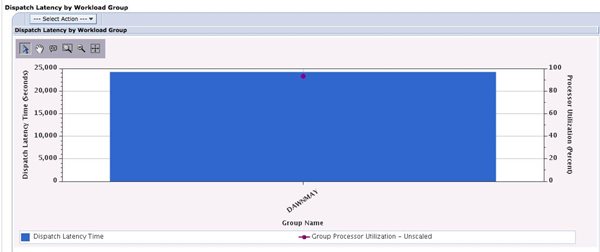
My workload group, DAWNMAY, suffers from dispatch latency. This tells me that my workload was being constrained by the single core I configured for that workload group.
The drill-downs lead you to more details. You must click on the workload group you want to drill into. (Note that my example has just one workload group. Multiple workload groups will all be displayed on the above chart.) We’ll start with the Dispatch Latency Totals by Thread for One Workload Group drill down.

This drill down results in a chart which is very useful for determining which jobs were delayed due to the workload group configuration:

I can see that one of my looping jobs had quite a bit of latency, white the other four had less delay time. One of my prestart jobs was also impacted, while the FTP transfer was not affected very much.
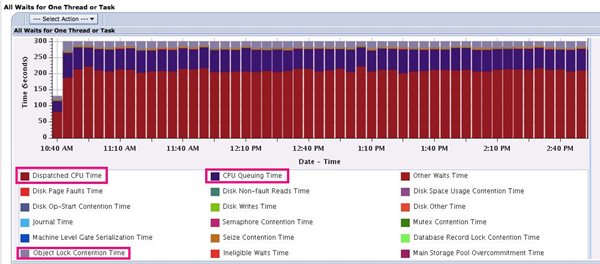
I clicked on the job with the most delay time then took the All Waits for One Thread or Task drill down:

In the next screen capture, the dark red is dispatched CPU time, the purple is CPU queuing and the gray layer is object lock contention time. The CPU queueing time reflects the dispatch latency that was introduced by limiting the work in that one subsystem to one core. Because of the amount of purple in the graph, it’s clear this job wanted to use more CPU, but was limited to one core by the workload group. As a consequence, the job was queued, waiting to run. The object lock contention time was self-inflicted by my simplistic loop program; all five jobs were doing a DSPOBJD to the same output file.
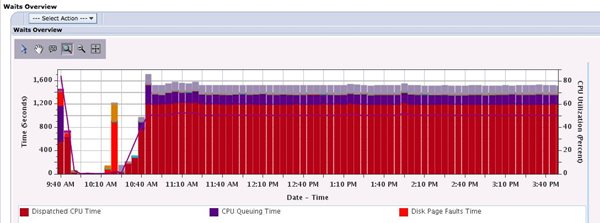
There is one final drill down, Waits Overview. The chart below shows all waits for the entire partition. It looks similar to the All Waits for One Thread or Task because my environment was very simple—all the work on the entire partition was running in my one subsystem constrained by that one workload group. This chart shows me one additional thing: My partition CPU utilization was constant at 50 percent. This makes sense because my partition has two processors. Because my workload was constrained to one core, I can’t go over 50 percent if all my work is running in that one one subsystem.
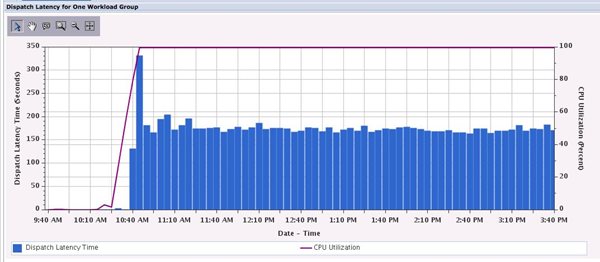
Let’s go back to where we started, Dispatch Latency Totals by Workload Group, but take the second drill-down, Dispatch Latency for One Workload Group. Again, I select the workload group for the drill down, which displays the graph below. However, in this case we’re seeing the dispatch latency for that workload group over time. You can see that I ramped up my test at around 10:30AM, and once the workload was running, I had latency occurring throughout the day, which is consistent with my contrived test. This graph is useful for those with workload peaks to help determine how much capacity your application needed to service the peaks without latency issues.
Workload groups are a wonderful feature of IBM i, but they are underused. You should consider using workload groups to cap certain applications to prevent them from using too much CPU—whether it is for licensing reasons, or to better control unexpected and unimportant work from impacting your production environment.
The Performance Data Investigator has everything you need to understand the performance implications of workload groups with just a few clicks—and now you know where to find the charts.
This is a great example of why IBM i is the best-of-the-best when it comes to configuration, management and analysis of workloads that run on it.