Investigate Prestart Jobs
Collection Services is always running on your system and you can use the Performance Data Investigator with Collection Services data for insights into your prestart jobs

Collection Services is always running on your system and you can use the Performance Data Investigator with Collection Services data for insights into your prestart jobs.
If you’re not familiar with the Performance Data Investigator, an internet search will reveal several articles and presentation PDFs (many created by myself). The best resource available online is the replay of the An Introduction to the IBM i Performance Data Investigator webinar.
With PDI and Collection Services data, you can display many different types of metrics—job statistics, wait information, CPU utilization, page faults, storage allocation, I/O, and more—in a variety of ways: partition overviews, by job name, generic job name, job user profile, job current user profile, subsystem, server type, and job pool. This information is helpful in general, but some perspectives are particularly useful for prestart server jobs.
The following screen capture shows the CPU perspectives. If you expand other folders within PDI, you will find similar options to review that data by various groupings.
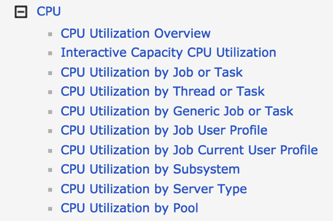
Let’s review the groupings that are most helpful when reviewing performance data related to prestart jobs:
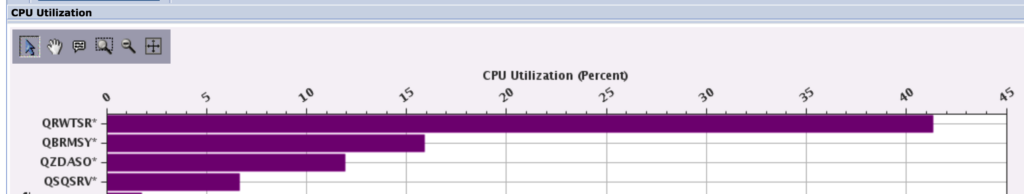
- Generic job. This is a great way to assess the overall work being done by prestart server jobs. If I wanted to review the CPU consumed by database requests, I could look at the data by generic job and see something like the following. This chart tells me that I have database requests handled by the QRWTSRVR, QZDASOINIT and QSQSRVR jobs.
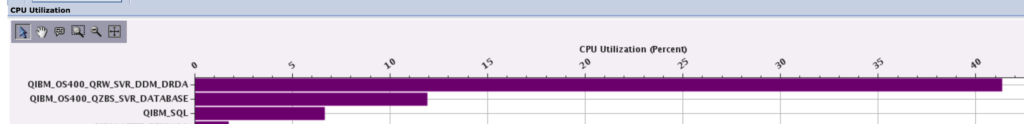
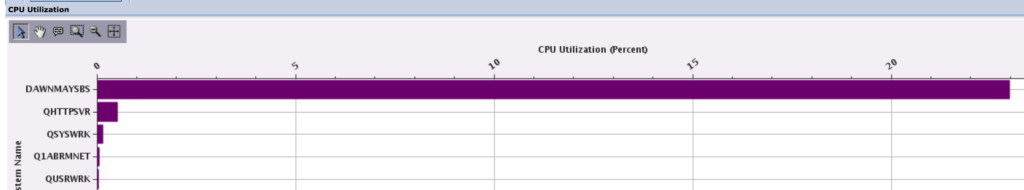
- Server Type. I can get similar information reviewing performance data by server type. In this example, I’m still looking at CPU utilization, but this time by server type. This perspective filters out the BRMS workload we saw above when using a generic job name. For our prestart jobs, we see the server type rather than the job name. (If you’re not familiar with server type, Identify Your Server Jobs reviews the server type information).
- Job current user profile. The above perspectives are helpful at understand the overall workload by the type of job, but they are not helpful in understanding who is requesting the work. The perspectives by current user profile can help you understand what users are consuming the most resources. Looking at CPU Utilization by current user profile, you can find out who is requesting the most work, as the next screen capture shows. However, it doesn’t help you understand what jobs are doing the work.
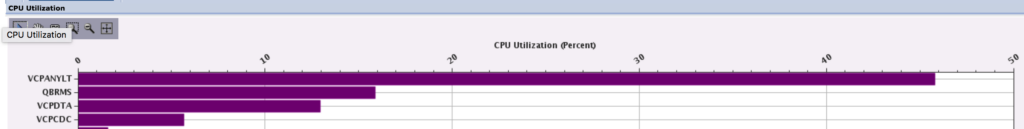
PDI makes it easy to take the next step—you can select a user profile and drill down and look at the jobs that made up the summary view.
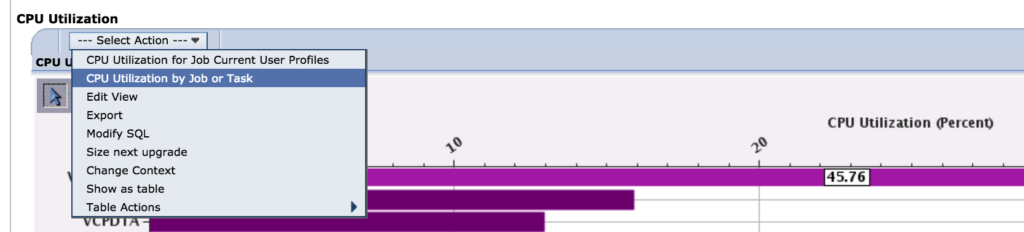
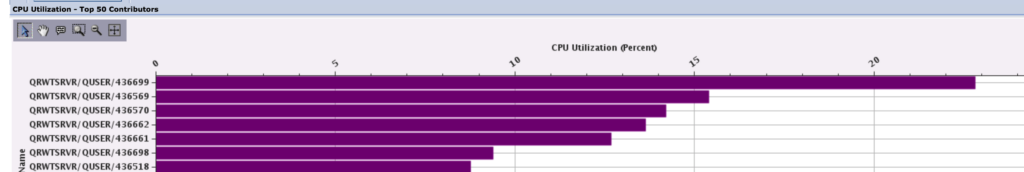
By taking the drill down, CPU Utilization by Job or Task, you’ll find the contributing jobs. This drill down confirms that the VCPANYLT user profile is the current user for the DDM/DRDA work that runs in the QRWTSRVR jobs.
- By subsystem. If you are taking advantage of the ability to route your work to different subsystems, these perspectives allow you to view the workload by subsystem. This perspective displays all subsystems, which can be useful to understand where the majority of the work is running. From here, you can select a subsystem and review the jobs running in that subsystem.
There are a lot of Collection Services charts within PDI that can be useful to help you understand how what work is being done by your prestart server jobs.