Performance Implications for CICS Applications Using COBOL Version 6
Rocket Software’s Ezriel Gross highlights a methodology for CICS problem analysis and performance tuning—and shares how it led to a 92% savings in CPU for a heavily used transaction

Tuning CICS applications and systems can improve performance and reduce costs, but it requires patience and testing to ensure the results are as expected. It’s like mining for gold: Sometimes you strike out and other times you hit pay dirt. When I taught performance tuning for CICS, I always said you must verify and often publish your results for others to view, as occasionally the results are worse, not better.
Tools for CICS Tuning
I use several tools when tuning or performing problem analysis on a CICS system. IBM OMEGAMON for CICS is the monitor I use to detect problems and sometimes automatically remediate them without having to get involved. I also use the product to identify possible tuning opportunities in both systems and the underlying applications.
To verify what I find, I use IBM CICS Performance Analyzer, which allows me to see exactly how bad the problem may be and how often or when it occurs in an environment. I can print tabular reports using the product or stream the data into an analytics engine such as Elastic and visualize the data.
Lastly, I use Rocket C\Prof, which collects CICS trace without running in a CICS region, to forensically analyze applications to see exactly what they are doing that could be causing an issue. I call this my detect, verify and solve method for CICS problem analysis and performance tuning.
CICS Tuning Case Study
While working with a customer using the methodology above, I found a bug that when fixed, achieved greater than a 92% savings in CPU for a heavily used transaction. I discovered a documented performance issue that customers may experience when converting from COBOL version 4.2 to any COBOL version 6 release. Although it is documented by IBM as an issue that can occur, it is difficult to detect and verify, and unless there is some indication that this is occurring, most customers would not even think it could be an issue in their environment.
In the example described here, this customer already knew there was a performance issue, as their CICS systems were using way more CPU than they had in the past. They identified the possible timeframe, but could not determine the cause with their monitor, only that during certain times of the day the problems were so bad they had to turn on capacity on demand (COD) to ensure they were meeting their service-level agreements (SLA).
Using CICS Performance Analyzer, we found one transaction identifier, HV50, that was only .0996% of the total transaction volume but used 12.36% of the total CPU and 27% of total quasi-reentrant (QR) TCB CPU. The data was from 15-minute samples on two separate days, during one of the busiest periods of the day. This gave us the starting point for some deep analysis.
Using Rocket’s C\Prof product we collected a few trace records associated with the HV50 transaction.
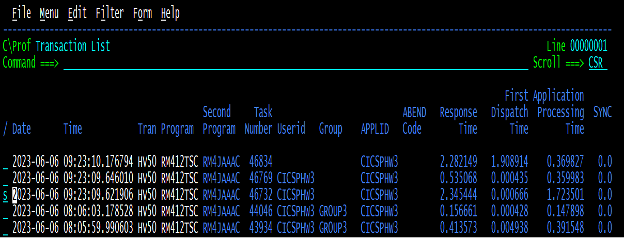
C\Prof collects the CICS trace but displays it separately by transaction, making it easier to look at the trace associated with a single transaction’s execution. It will even aggregate traces from multiple CICS systems, giving you the ability to see all mirror transactions as part of a single execution.
When we select the worst one in terms of response time (“s” in Figure 1) , we can see what the transaction was doing to cause such long response times.
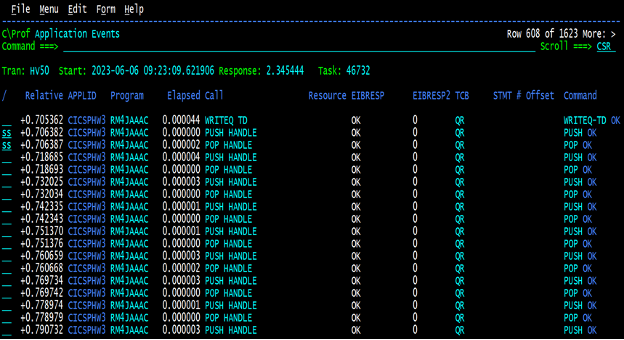
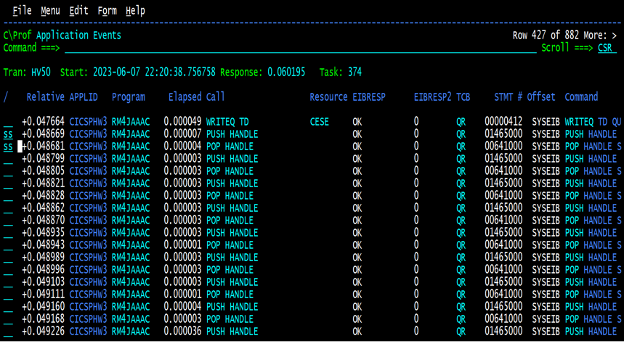
C\Prof summarizes the internal trace into high level easy to consume entries so you can easily find where the delays may be. Looking through the transactions trace records above, we noticed a bunch of these PUSH/POP handles where the response time of the commands did not seem to be an issue, but between them you can see a jump in the relative response time that seems excessive. What’s more, as we looked at several of these transactions there seemed to be a flurry of PUSH/POP handles that was not consistent across other transactions. Sometimes there were as few as ten to fifteen and sometimes there were hundreds of them. So, we issued the (ss) commands in Figure 2 to drill down to the actual trace.
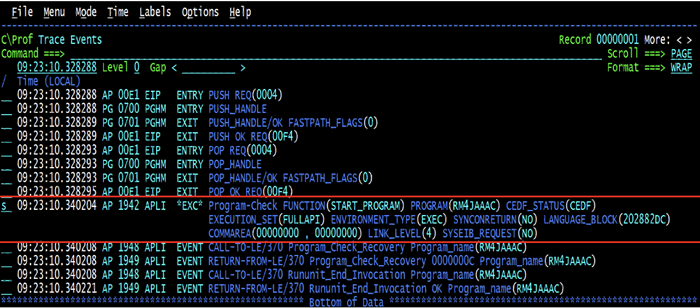
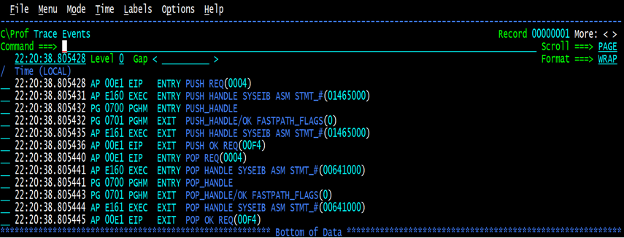
Lo and behold, the underlying trace shows that between the POP handle exit and the next PUSH operation a program check was occurring. We checked all the PUSH/POP handle pairs, and they all had the same condition.
Anyone who has been around CICS for a few years knows that any sort of abend condition is very expensive. When CICS detects an abend the entire address space abends and recovery starts in an extended specified task abnormal exit (ESTAE/ESTAEX) macro. When it is determined that this is not CICS nucleus code failing, the abend is converted from and AKEA to an ASRA, so two abends occur but the system remains up and running.
To see exactly what the situation was here, we used the “s” command to drill down to the full trace.
Looking at the full trace, we can see that there is an 0CA abend, which is a decimal divide exception. What we did not understand is why the next set of trace did not show us going to the abend handler routine associated with this program. What’s more, we did not see the conversion from AKEA to ASRA as mentioned above.
With a little more research, and going back to Figure 3, it would appear that the language environment (LE) was detecting the abend and recovering without notifying anyone of the situation.
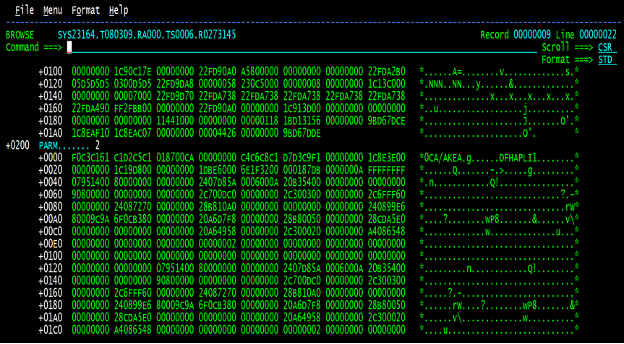
To verify this, we took a SNAP dump of the CICS region, and had a look at the kernel domain (KE) using the “VERBX DFHPDvrm ‘KE=1” IPCS command under option 6. Then, we scrolled down to the bottom of that listing to see what was in the the kernel error table.

The KE error table in the dump showed us three things. First: A single task (46732) was getting this abend repeatedly and recovering. The second was that the kernel error table can hold 50 entries in a wrapping table, but the ERR_NUM column counts in hex the number of abends this CICS region has experienced since the start. So, by 9:23.11 a.m. this CICS region had experienced 100,468 abends, although not all of them would necessarily be this one. Lastly, it gave us the offset in the program (we know the name from the C\Prof trace summary as RM4JAAAC) of the next sequential instruction after the abending instruction. We looked at the instruction, and it was:
MOVE SHUFFLED-OUTPUT-LINK TO parsed-field-n
                            parsed-field-n7
Where the fields were defined as:
05 SHUFFLED-OUTPUT-LNK PIC 9(12)V9(6) COMP.
05 PARSED-FIELD-N PIC S9(9)V99.
05 PARSED-FIELD-N7 PIC 9(7).
Although the MOVE instruction would result in truncated results, there was no reason to believe there was any issue with this code. So we decided, as the abend was occurring in IBM code and not part of the application (as our abend handler was not invoked), it was time to open a problem with IBM to figure out what was going on.
IBM sent us this link, which explained what we were experiencing.
This page describes a change that occurred at COBOL v6 regarding interlanguage communication (ILC) applications, applications written in two or more high-level languages (such as COBOL, PL/I, or C—and frequently, assembler), and how the data is mapped across load module boundaries.
“COBOL normally either ignores decimal overflow conditions or handles them by checking the condition code after the decimal instruction. However, when languages such as C or PL/I are in the same application as COBOL, these decimal overflow conditions will now be handled by LE condition management since both C and PL/I set the Decimal Overflow bit in the program mask. This can have a significant impact on the performance of the COBOL application, especially under CICS, if decimal overflows are occurring during arithmetic operations in the COBOL program.”
Later in the documentation we found the following note:
“For a COBOL program using COMP-3 (PACKED-DECIMAL) data types in 100,000 arithmetic statements that cause a decimal overflow condition, the C or PL/I, ILC case was over 99.98% slower than the COBOL-only, non-ILC case.”
Only one more issue remained. This was a COBOL only application, so why the issue? Well, further in the document there is a reference to COBOL features that will have the same effect, and one of them is “XML PARSE,” which was being used by this application. These features (see the link above for the full list) are written in C, and therefore experience the same issue as an ILC programming environment. So, now we had our smoking gun.
The question became how to fix it. The answer was relatively simple. Increase the COBOL field sizes of the receiving fields so they matched the moving field, which was a total of 12 bytes in length. So, to ensure the application returned the exact same results, we added FILLER statements to pad out the fields.
05 SHUFFLED-OUTPUT-LNK PIC 9(12)V9(6) COMP.
* 05 PARSED-FIELD-N PIC S9(9)V99.
05 PARSED-FIELD-N12V2 PIC S9(12)V99.
05 FILLER REDEFINES PARSED-FIELD-N12V2.
   10 FILLER PIC X(3).
   10 PARSED-FIELD-N pic 9(09)V99.
* 05 PARSED-FIELD-N7 PIC 9(7).
05 PARSED-FIELD-N12 PIC 9(12).
05 FILLER REDEFINES PARSED-FIELD-N12.
   10 FILLER PIC X(5).
   10 PARSED-FIELD-N7 PIC 9(7).
This allowed us to keep the original field names for use by the rest of this program and others, while fixing the decimal overflow condition. The MOVE instruction was changed as follows:
* MOVE SHUFFLED-OUTPUT-LNK TO PARSED-FIELD-N
*                             PARSED-FIELD-N7
MOVE SHUFFLED-OUTPUT-LNK TO PARSED-FIELD-N12V2
                            PARSED-FIELD-N12
This ensured integrity in the remainder of the program, as the original fields could be referenced as is, and the program would execute in the same way it did before the change.
So, with the solution in hand the only thing left was to verify that it actually fixed the problem and see how the fix improved the overall performance of the system. Considering we would have to run for at least a day to check the SMF data using CICS Performance Analyzer to verify any reduction in CPU, we started by running a few HV50 transaction, collecting the trace with C\Prof to see that the abend was no longer occurring.
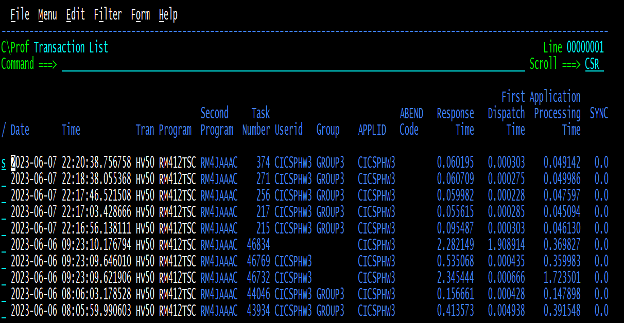
Figure 6 shows that the transactions captured before and after the change appeared to be running a magnitude of 10 times faster than on the previous day without the change; this was a good sign that the problem was resolved.
Diving into the C\Prof summarized trace below also showed that the PUSH/POP handles now had an insignificant delay between them unlike what was seen prior to the change.
Finally, when performing a deep dive to the trace entries associated with the PUSH/POP handle, it could easily be seen that the abends that had occurred in the past were completely gone.
The only task left was to determine how this change affected the overall system. We looked at the SMF data for a Monday prior to the change and the Monday after the change to get a view into what the overall savings was, and the results were astonishing.
Keep in mind that getting a better picture of the actual overall savings would require collecting weeks or months of data for comparison.
Here are the transaction statistics, comparing one Monday to the next:
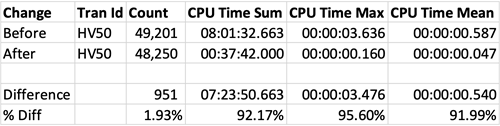
In plain English, that means the difference between the CPU time for the HV50 transactions comparing one Monday prior to the change to the Monday after the change was 7 hours, 23 minutes, 50.662684 seconds, which represents a greater than 92% savings in CPU. Keep in mind there were 951 fewer transactions on the following Monday—or almost 2% fewer—but nonetheless a significant difference.
The bottom line is, aside from this showing the possible dangers of migrating from COBOL version 4.2 to version 6, it also points out that to ensure your applications are performing optimally, you need to monitor your applications after any and all system changes. That way, any changes required to support new software can be implemented before they become a performance problem that can affect your entire system.