SQL Stored Procedure Tutorial
How to use a SQL stored procedure for data retrieval to feed a DB2 Web Query for i dashboard document.
What are the first things you think about with Business Intelligence dashboard reporting? Where to get the data? How to retrieve the data from the ERP or Business system database? How to format data to make it easily used and understood? These are all key questions.
Previously, I explored a few dashboard concepts and potential data presentation techniques and formats. In part 1 of this two-part series, I’ll explore using an SQL stored procedure for data retrieval to feed a DB2 Web Query for i dashboard document.
Background
If you haven’t used stored procedures much, know that they can be created in two ways: by wrapping a high-level language program with SQL or by writing strictly in SQL. The HLL language program, written with RPG, COBOL, C or Java might use embedded SQL or native I/O methods to access DB2 data. Alternatively, using SQL to entirely define your procedure, you employ the SQL procedures language (SPL) which adds logic control to the other SQL statements you are likely familiar with, providing a robust programming environment. Neither approach is better than the other. Your choice depends on your environment, skills and reporting requirements. When high-level languages are utilized, these procedures are called External procedures. Procedures can accept zero, one or more parameters as input, can return zero, one or more parameters as output and can also return zero, one or more Result Sets. It’s the result set capability that inspires this article, a powerful and useful tool for building reports and dashboards in Web Query.
Before choosing your venue, External or SQL, consider which languages you’re familiar with and whether you have important business logic already developed. If, time-tested RPG business logic already exists and provides the data you need, then you might want to make that logic available via SQL. Reusing your existing program logic might be the fastest path to realize your reporting objectives.
A Simple SQL Stored Procedure
In this article, I am going to illustrate using a simple SQL stored procedure. It utilizes neither input nor output parameters. When called from either Run SQL Scripts or DB2 Web Query for i, the procedure will execute the enclosed SQL statements and return a Result Set for each declared cursor. Think of cursors, in this situation, as a pointer to results from each of the executed statements. The Web Query designer will show each of the result sets, with the fields for each, so that you can choose them for either charts or reports. Note that result sets are used on a “per-report” basis; you can’t mix fields from two different result sets in a single report.
Suppose your dashboard idea calls for a presentation of revenue generated in three distinct ways: by salesperson, by plant and by store. In the old-school Query/400 way, this involves three different reports, right? But with Web Query, it’s possible to present this data as reports or charts or both, if needed, all on a single page. This is where the power of the Stored Procedure (SP) can come into play. Figure 1 below shows part of the SQL procedure code that defines the procedure, to be named DASH2, which will return four result sets, and the needed SELECT statements.
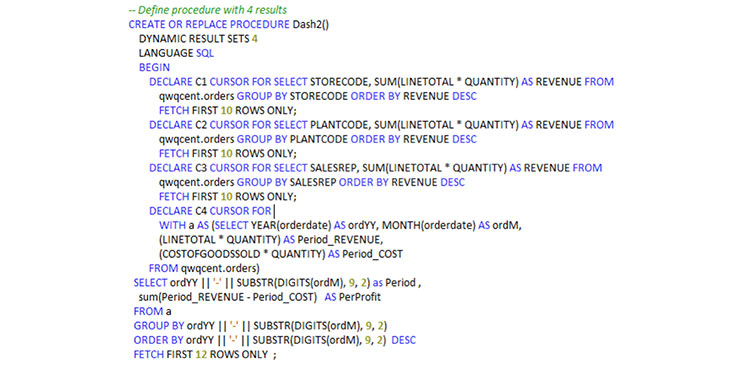
If I’d used input/output parameters, I would have defined them after the name of the procedure. In this case, I have none to define, but I need to specify that I expect four results and, that I’m using SQL as the language. Any statements between the BEGIN and END keywords of the procedure represent the logic of the procedure. Figure1 (above) shows code from the top of the SQL procedure.
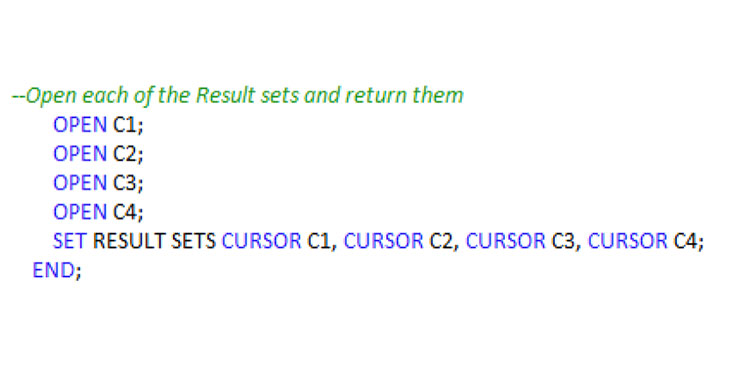
Subsequent SQL logic that opens and returns the results, shown in Figure 2 below, represents the bottom of the procedure. The combined code in these two figures, contains all the SQL that is needed for this application, to create the procedure and return data. This procedure code is a vehicle for giving Web Query access to the results. How you might implement your own reporting scenario is up to you and will depend upon your application, site objectives and standards. Your SQL select statements could be more complex, or could reference SQL Views, themselves having greater complexity.
DECLARE Statement
The DECLARE statement allows us to define a SELECT statement that will run when we OPEN the named Cursor, in this case, called C1. In this SELECT statement, (see Figure 3 below; click to view larger), I want DB2 to summarize an orders file to determine revenue by store, sorting the result by summarized revenue dollars in descending sequence and retrieving only the first 10 rows. This result gives the total sales for the top-10 stores.
The Select statements for C2 and C3 do a similar process for Plants and Sales Reps respectively.
Web Query
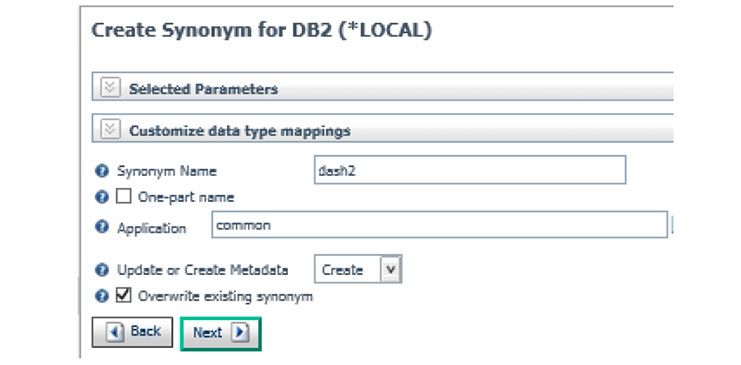
After you’ve created, tested and validated the results of your stored procedure, using Run SQL Scripts, make those results available for reporting in Web Query. Do this with the create metadata function, where you can pick a DB2 object and use it within the Create Synonym panel. By telling Web Query you wish to make metadata for the Stored Procedure type, you can specify your library and object, or pick from a generated list of objects.
The screen where you create the synonym is shown in Figure 4 below. In my case, I recreated the synonym called DASH2, so I checked the overwrite existing box before pressing the Next button to generate the synonym.
InfoAssist
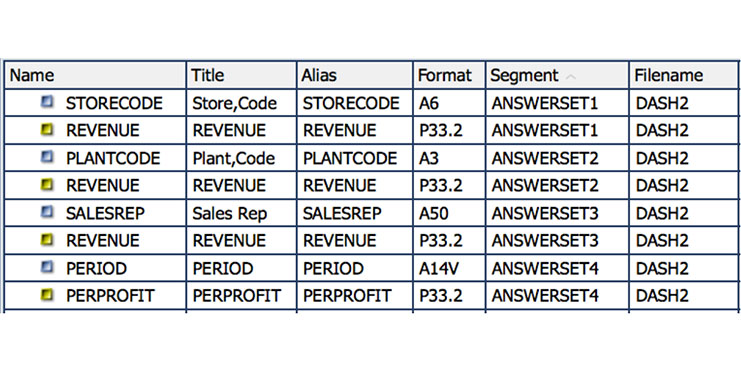
Once the synonym exists, when a new document is created, the InfoAssist (Web Query Report Designer) data source screen opens; the DASH2 data source will be available for selection. Once selected, the fields defined within the data source are shown (see Figure 5 below) in the Data panel of InfoAssist. Notice that the four numbered answer sets listed in the Segment column are the resulting fields generated by the four SQL cursors that were made available by this stored procedure. ANSWERSET1 corresponds to the result from cursor C1 in the procedure, and so forth. Had my procedure utilized input parameters, I could have seen an INPUT segment as well as ANSWERSET(s) segments.
Upon opening, InfoAssist offers a blank document canvas on which to design reports for our proposed dashboard. With results available from the stored procedure, our task becomes how to present them, inserting the appropriate reporting constructs into the document and positioning them in the desired locations.
Insert Report Process
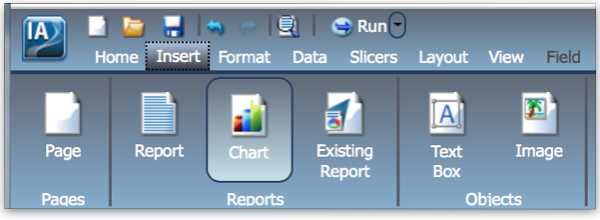
In InfoAssist, click the INSERT menu item on the ribbon bar to add a report or chart to the document (see Figure 6 below). Inserting a report will place a new report area on the canvas. Then you can double-click or drag fields from one data pane segment to the new report area.
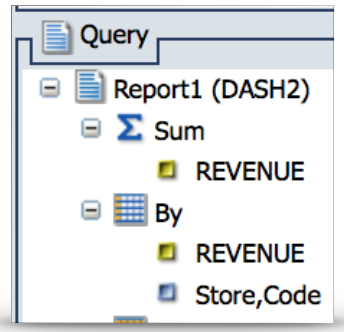
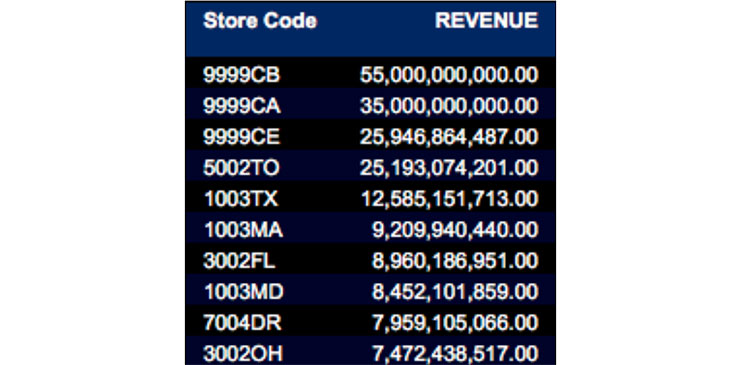
Using data from ANSWERSET1 (C1), when I drag both the Store and Revenue fields from Answerset1 to the new report, this yields a Query area result that looks like Figure 7 below and a report on the canvas like Figure 8 (also below).
The insert report/chart process must be repeated for however many presentations of data are necessary to utilize all of results from the stored procedure. In this example, I used both a report and chart for STORES (C1), PLANTS (C2) and SALESREPS (C3) respectively, to see both a textual report and a chart presentation for those items.
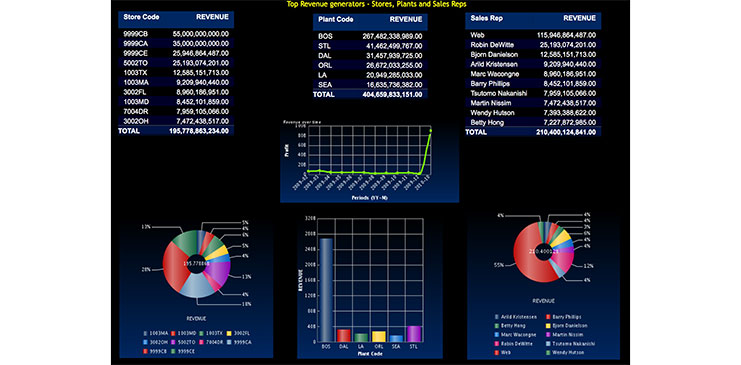
Figure 9 below (click to view larger) shows a resulting document dashboard, containing charts and reports created from the stored procedure data. It will be generated quickly by Web Query, whenever I execute the completed document.
The Power of A Stored Procedure
While this example has been relatively simple, it demonstrates the power of a stored procedure to provide multiple query results to DB2 Web Query for i. The stored procedure is created, made known to Web Query by creating metadata, and the results used in the InfoAssist design software, to create a document utilizing multiple results in appealing ways.
In Part 2, I’ll examine ways to enhance the resulting document, and further customize the dashboard’s capabilities and looks.