Ways to Work With Your JVMs in Navigator for i
One of my very first i Can blogs was “Work With Your JVMs,” written when the JVM CL commands (WRKJVMJOB, DSPJVMJOB, PRTJVMJOB, and GENJVMDMP) were added in the 6.1 release. Since that time, IBM added additional ways to work with your JVMs. This post provides updated information on the features available in Navigator for i for working with your JVMs.
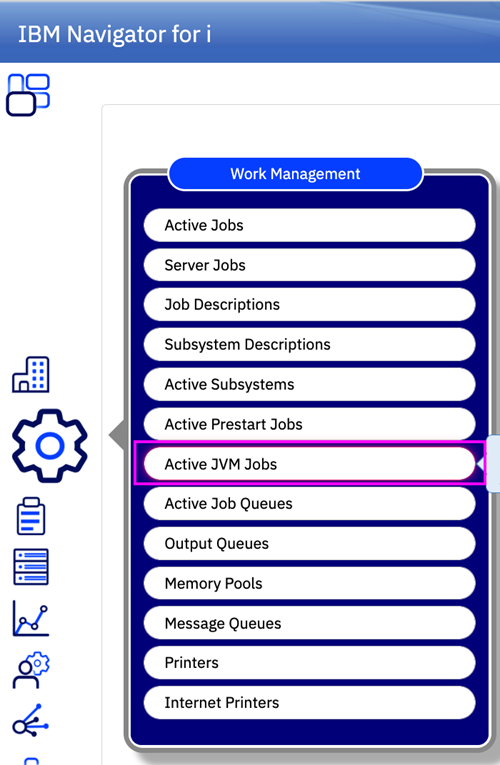
Active JVM Jobs
Navigator for i enhancements now display JVM information. Active JVM Jobs can be found under the Work Management tasks, as the following figure shows.
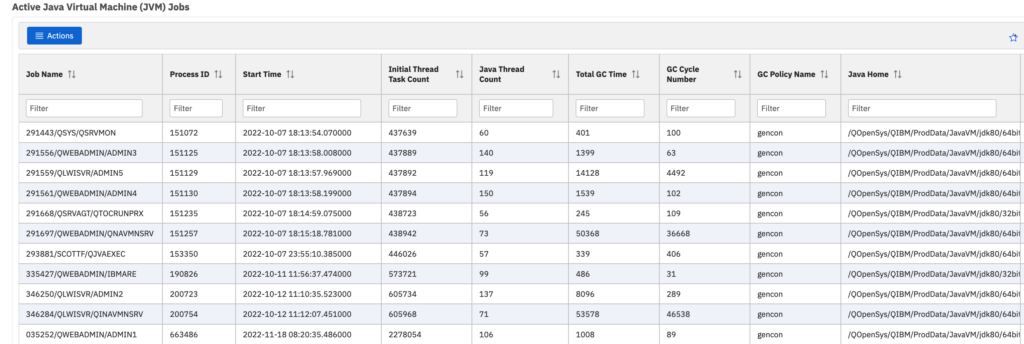
When you view Active JVM jobs, there is a table with a row for each JVM job; the attributes available are the same when using QSYS2.JVM_INFO.
IBM i Performance Data Investigator: Java Perspectives
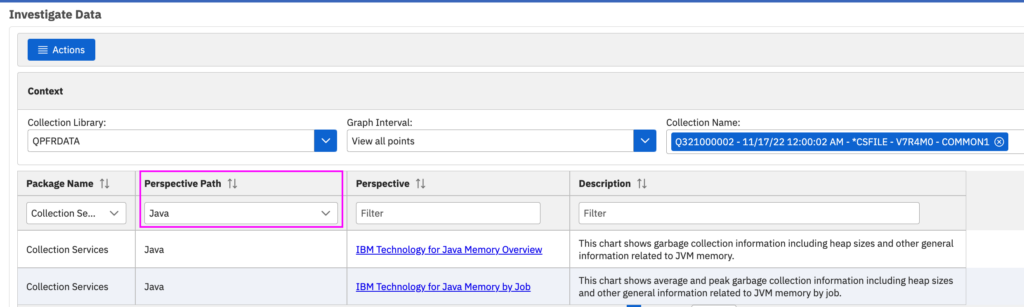
You can review your JVM memory usage with the IBM i Performance Data Investigator (PDI). The charts displayed with PDI are based upon Collection Services data found in the QAPMJVM.
The navigation in PDI is different from Heritage Navigator; the Java perspectives are still in the Collection Services content package, but drilling down to locate the perspectives has changed. The figure below is an example of where you find the JVM charts.
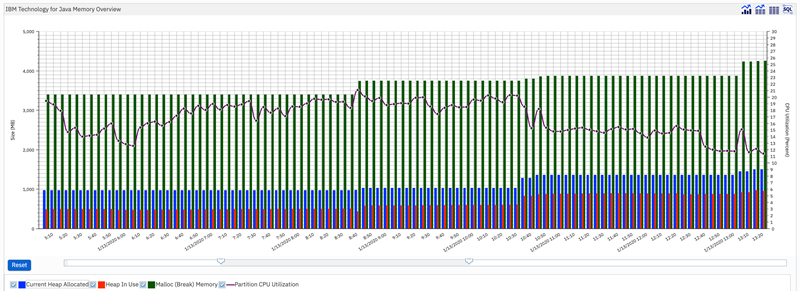
When you display the IBM Technology for Java Overview chart, you will see Java memory information. Note that this chart displays three bars for each interval, so the initial view may be a bit confusing. Zoom in to see the interval details.
You can also review Java memory by job, either for the entire collection, or by drilling down from the Java Memory Overview chart. Find an example in the following figure.
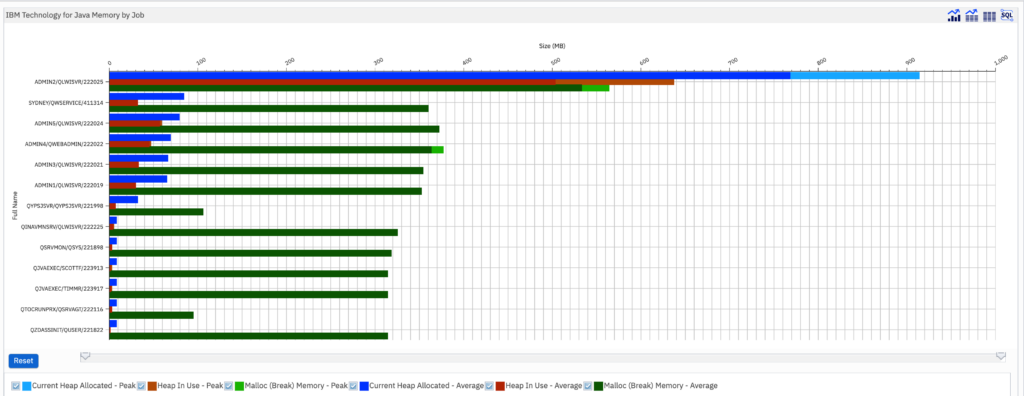
Also note that using PDI to review JVM jobs allows you to view this information over time, whereas the other methods are a snapshot of the current environment.