Using a Metric Database to Populate Dashboards for IBM i
Rick Flagler explains how to create a database to contain metrics for dashboard reporting—for the sake of performance, simplicity and flexibility

In a prior article I illustrated how you could create a dashboard using an alternative to IBM Db2 Web Query for i, and promised a future article about building and populating a metric database. As I fulfill that promise, first I’ll explain the why, then the how.
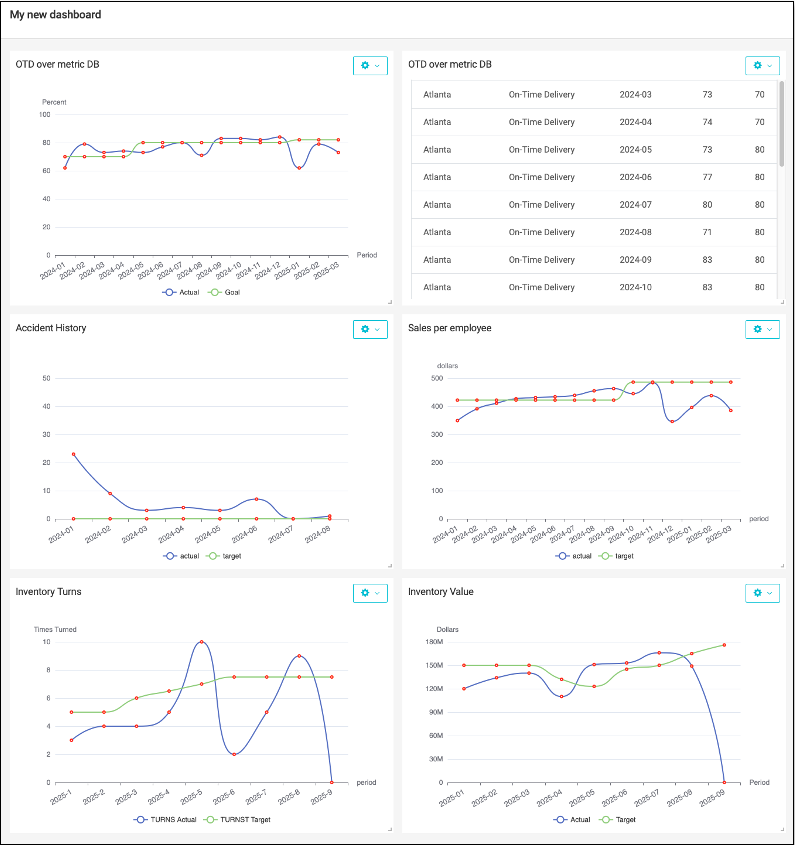
Although Db2 Web Query for i is no longer supported by IBM, there are several other products that can fill the void, containing common features to construct charts and present them in a dashboard arrangement. Below is an example dashboard with several metrics. Each metric is being tracked over recent months. In this case, the metrics are being plotted with a SPLINE chart, which is a type of line chart with softened curves between points rather than point-to-point straight lines. Most business intelligence products offer choices of this type of chart.
Each of the metrics shown in Figure 1 is made up of a numeric value on the X-axis, such as a percent, a quantity or a dollar value. They have time in common, expressed as a period in YYYY-MM format on the Y-axis.
Why
Performance, simplicity and flexibility are the primary reasons you might create a database to contain metrics for dashboard reporting. Performance is likely to be better when the program reads fewer records while using the data to build the dashboard and plot the values on charts.
Consider a metric such as sales dollars. In order to plot sales over time, using values available at the end of each month, you could summarize historical sales transactions by year and months in the past. Depending upon the business, there could be thousands or even millions of sales transactions processed within each month. Performing several individual queries reading operational sales records for every dashboard user could put considerable load on the server. By contrast, a sales query executed once at the end of each month could capture the sales volume that occurred during the month and insert the single month-end result into a metric record.
For a sales chart that probably needs only 12 to 24 monthly values to plot the historical sales and forecast, it might be much more effective to run a period-end query once and populate a metric table with the results. Rather than querying operational records each time the dashboard is refreshed, only records for metrics needed by the dashboard would be accessed.
How
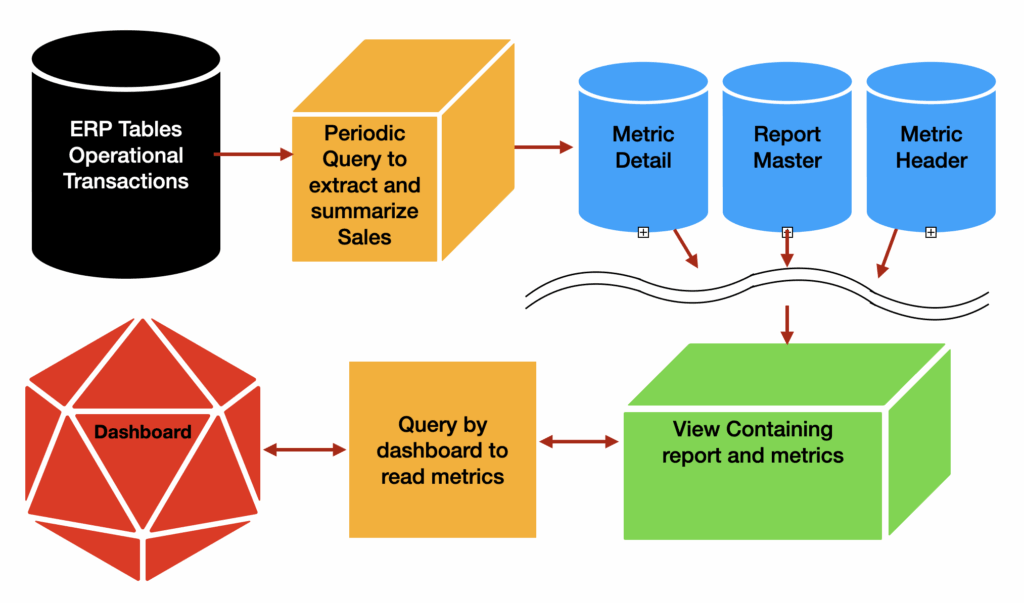
A metric database can be considered a type of data mart. It could be built using any database supporting SQL. Loading data into the metric records could be accomplished with procedural programs or SQL. Finally, the presentation layer could be any product that supports creation of charts and graphs. For this article, my database of choice was Db2 for i, and the dashboard generation techniques I’ll show you would work with any SQL database and any presentation layer.
Divorcing presentation from extraction has the potential to simplify period-to-date operations while leading to performance benefits as metrics are reviewed. There could also be a boost to accuracy since the data could be gathered by a scheduled job which always runs at a predetermined date and time.
In cases where I employed this technique, I utilized the IBM i built-in job scheduler to run programs written in RPGLE, but more typically SQL procedures, to harvest ERP data in required formats and post to a metric database. The job could run several queries, one each for the various metrics, posting the period ending values for each.
Database Definition
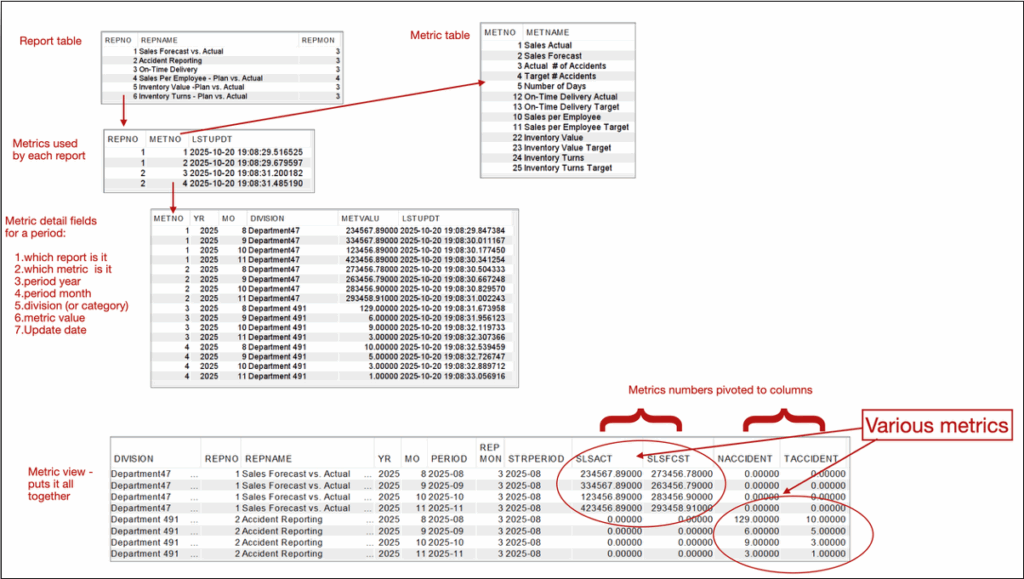
In my design for a metric database, I store a variety of individual metrics for time periods in several tables.
- The report table defines a unique report number, name and number of months to be depicted.
- The metric table defines a unique metric number and name for each metric to be tracked.
- The report_metric table links metrics to the report that uses them. This enables a metric to be used in more than one report.
- Finally, the metric detail table contains the meat of the data for each metric in a time period for each metric, the report#, the metric#, the date info, a division or category and the actual metric numeric value for the period.
With these tables, I can define reports and specify which metrics (one or more) are used on a report and even a duration to be plotted. Figure 3 shows some sample data to illustrate how these tables relate and how a view can join everything together.
Once the view is created it can be queried by the presentation layer, providing a single data source for multiple metrics on a dashboard.
The dashboard’s content is typically driven by application reports constructed in the tool, often using the result set from a program or SQL statement to provide data. Data likely comes from a table or view object. In either case, some runtime parameters might be passed to the chart in a URL to influence the content and presentation.
Using SQL increases flexibility because of the ability to retrieve system values or perform SQL functions and calculations as the data is retrieved. Most BI software has a feature to enter and edit SQL, allowing you to enter and test a SQL statement query over tables or models.
For example, suppose I need to show a chart for the current year but I prefer not to have hardcoded year values filtering my report? I can employ the power of the database to obtain the value provided by Db2’s CURRENT DATE phrase or, in MySQL syntax, curdate() to return the date in YYYYMMDD format. Wrapping the date function with function YEAR( ) would return just the year portion of the date, e.g., 2025. This year value can be compared to a database column to include only the records in that year. Also, suppose you need to pass some parameters? You can often do so in the URL of a web-based call.
Such techniques may accomplish filtering of the data by passed parameter values. For our metric database the report number (REPNO) and division (DIVISION) could be important substitutions. In the end, these could end up in the WHERE clause of the SQL statement and passed to the report. Examples of SQL to use such substitution in a report definition might look like this:
select * from METRIC1
where yr = trim(year(curdate() ))
and repno = ${REPNO} and division =  ${DIVISION}
The returned result set from this statement will contain all columns in METRIC1, where the records are for the current year and contain the substitution variable passed for report# and division. The presentation layer would have to make the substitutions in the URL and would get an error if they aren’t provided. The URL parameters might be as follows.
&DIVISION=Division2&REPNO=1
In the presentation layer, you need to pick the type of chart and assign the fields to be used. In many of my examples in Figure 1, the value on the X-axis is the date (PERIOD) and on the Y-axis are one or more numeric values such as QUANTITY or DOLLARS.
Additional Chart Features
Drill-down
Drill-down is a chart configuration feature for most products and chart types. You’ll need to specify whether drill-down is turned on or off. When used, you might also have to specify whether to open the drilled-to-report target in a new window or the same window. You select a previously created target report and establish any passed parameters that the links have in common.
With drill-down enabled, clicking on a line or bar in the chart opens the related report. Drilling down to another report in this manner allows users to perform discovery about the metrics seen on the dashboard.
Dashboards are very powerful business tools, and using a database behind them can reduce response time, simplify presentation and improve consistency, regardless of the specific dashboard product you choose to utilize.
The Db2 code to create and link tables to construct the metric database described in this article is provided below. Replace the library name YOURLIB with your preferred name.
===== Code =====
— SQL to create metric database on IBM Db2 for i
— create report definition header
CREATE or replace TABLE YOURLIB.yMETREP (
 REPNO NUMERIC(10, 0) DEFAULT NULL ,
 REPNAME CHAR(50) CCSID 37 DEFAULT NULL ,
 REPMON NUMERIC(3,0) DEFAULT NULL,
 CONSTRAINT YOURLIB.yMETREP_REPNO_PK PRIMARY KEY( REPNO ) )  ;
LABEL ON TABLE YOURLIB.yMETREP  IS 'Metrics report header' ;
LABEL ON COLUMN YOURLIB.yMETREP (
 REPNO 	TEXT IS 'Report Number' ,
 REPNAME 	TEXT IS 'Report name/description' ,
  REPMON 	TEXT IS 'RNumber of months  in report'
 );
— create metric definition header
CREATE TABLE YOURLIB.yMETHDR (
 METNO NUMERIC(10, 0) NOT NULL ,
 METNAME CHAR(50) CCSID 37 DEFAULT NULL ,
 CONSTRAINT YOURLIB.yMETHDR_METNO_PK PRIMARY KEY( METNO ) )  ;
LABEL ON TABLE YOURLIB.yMETHDR IS 'Metric header' ;
LABEL ON COLUMN YOURLIB.yMETHDR (
 METNO TEXT IS 'Metric identifier' ,
 METNAME TEXT IS 'Metric name/description' ) ;
— create metric detail for periods and values
CREATE TABLE YOURLIB.yMETDTL (
 METNO NUMERIC(10, 0) NOT NULL ,
 YR DECIMAL(4, 0) DEFAULT NULL ,
 MO DECIMAL(2, 0) DEFAULT NULL ,
 DIVISION CHAR(25) CCSID 37 NOT NULL DEFAULT ' ' ,
 METVALU DECIMAL(15, 5) DEFAULT NULL ,
 LSTUPDT TIMESTAMP DEFAULT CURRENT_TIMESTAMP ,
 CONSTRAINT YOURLIB.yMETDTL_REPNO_PK PRIMARY KEY( METNO , YR , MO , DIVISION ) )  ;
LABEL ON TABLE YOURLIB.yMETDTL IS 'Metric Details for Division, Year and Month' ;
LABEL ON COLUMN YOURLIB.yMETDTL (
 METNO TEXT IS 'Metric Identifier' ,
 YR TEXT IS 'Year' ,
 MO TEXT IS 'Month' ,
 DIVISION TEXT IS 'Division' ,
 METVALU TEXT IS 'Metric Value' ,
 LSTUPDT TEXT IS 'Last Update' ) ;
— create table to link metrics to reports
CREATE TABLE YOURLIB.yMETREPDTL (
	REPNO NUMERIC(10, 0) NOT NULL ,
	METNO NUMERIC(10, 0) NOT NULL ,
	LSTUPDT TIMESTAMP DEFAULT CURRENT_TIMESTAMP ,
	CONSTRAINT YOURLIB.yREPDTLPK PRIMARY KEY( REPNO , METNO  ) )   ;
LABEL ON TABLE  YOURLIB.yMETREPDTL IS 'Reports  and Metrics table'  ;
LABEL ON COLUMN  YOURLIB.yMETREPDTL
(
 REPNO TEXT IS 'Report Identifier' ,
 METNO TEXT IS 'Metric Identifier' ,
 LSTUPDT TEXT IS 'Last Update' ) ;
— add constraints to link tables
ALTER TABLE YOURLIB.yMETREPDTL
	ADD CONSTRAINT YOURLIB.yMETREPDTL_METREP_FK
	FOREIGN KEY( REPNO ) REFERENCES YOURLIB.yMETREP ( REPNO ) ON DELETE CASCADE ON UPDATE RESTRICT ;
LABEL ON CONSTRAINT YOURLIB.yMETREPDTL_METREP_FK IS 'Foreign Key to METREP' ;

ALTER TABLE YOURLIB.yMETREPDTL
	ADD CONSTRAINT YOURLIB.yMETREPDTL_METHDR_FK
	FOREIGN KEY( METNO ) REFERENCES YOURLIB.yMETHDR ( METNO ) ON DELETE CASCADE ON UPDATE RESTRICT ;
LABEL ON CONSTRAINT YOURLIB.yMETREPDTL_METHDR_FK IS 'Foreign Key to METHDR' ;

ALTER TABLE YOURLIB.yMETDTL
	ADD CONSTRAINT YOURLIB.yMETDTL_METHDR_FK
	FOREIGN KEY( METNO ) 	REFERENCES YOURLIB.yMETHDR ( METNO ) ON DELETE CASCADE 	ON UPDATE RESTRICT ;
LABEL ON CONSTRAINT YOURLIB.yMETDTL_METHDR_FK IS 'Foreign Key to METHDR' ;
— create a view to tie all tables together
— NOTE: The field names will correspond to the metrics you define and the metric numbers are used to pivot the values into columns with meaningful names.
CREATE VIEW YOURLIB.yMETVIEW as (
	SELECT DIVISION, RM.REPNO, REPNAME, YR, MO, DIGITS(YR) || '-' || DIGITS(MO) AS PERIOD,  repmon,
	CHAR(year(current date - avg(REPMON) months) || '-' ||
		digits(dec(month(current date - avg(REPMON) months)+1,2,0)),7) as STRPERIOD,
— You may DYNAMICALLY LIMIT NUMBER OF MONTHS based on the REPMON column value for each report.
        SUM(CASE WHEN D.METNO = 1 THEN METVALU ELSE 0 END) AS SLSACT,
	SUM(CASE WHEN D.METNO = 2 THEN METVALU ELSE 0 END) AS SLSFCST,
	SUM(CASE WHEN D.METNO = 3 THEN METVALU ELSE 0 END) AS NACCIDENT,
	SUM(CASE WHEN D.METNO = 4 THEN METVALU ELSE 0 END) AS TACCIDENT,
	SUM(CASE WHEN D.METNO = 5 THEN METVALU ELSE 0 END) AS NDAYS,
	SUM(CASE WHEN D.METNO = 6 THEN METVALU ELSE 0 END) AS COPQ,
	SUM(CASE WHEN D.METNO = 7 THEN METVALU ELSE 0 END) AS COPQT,
	SUM(CASE WHEN D.METNO = 8 THEN METVALU ELSE 0 END) AS COPQSLS,
	SUM(CASE WHEN D.METNO = 9 THEN METVALU ELSE 0 END) AS COPQSLST,
	SUM(CASE WHEN D.METNO = 10 THEN METVALU ELSE 0 END) AS SLSPEMP,
	SUM(CASE WHEN D.METNO = 11 THEN METVALU ELSE 0 END) AS SLSPEMPT,
	SUM(CASE WHEN D.METNO = 12 THEN METVALU ELSE 0 END) AS OTD,
	SUM(CASE WHEN D.METNO = 13 THEN METVALU ELSE 0 END) AS OTDT,
	SUM(CASE WHEN D.METNO = 14 THEN METVALU ELSE 0 END) AS PREMF,
	SUM(CASE WHEN D.METNO = 15 THEN METVALU ELSE 0 END) AS PREMFT,
	SUM(CASE WHEN D.METNO = 16 THEN METVALU ELSE 0 END) AS EXPD,
	SUM(CASE WHEN D.METNO = 17 THEN METVALU ELSE 0 END) AS EXPDT,
	SUM(CASE WHEN D.METNO = 18 THEN METVALU ELSE 0 END) AS OTPRM,
	SUM(CASE WHEN D.METNO = 19 THEN METVALU ELSE 0 END) AS OTPRMT,
	SUM(CASE WHEN D.METNO = 20 THEN METVALU ELSE 0 END) AS EPPM,
	SUM(CASE WHEN D.METNO = 21 THEN METVALU ELSE 0 END) AS EPPMT,
	SUM(CASE WHEN D.METNO = 22 THEN METVALU ELSE 0 END) AS INV,
	SUM(CASE WHEN D.METNO = 23 THEN METVALU ELSE 0 END) AS INVT,
	SUM(CASE WHEN D.METNO = 24 THEN METVALU ELSE 0 END) AS TURNS,
	SUM(CASE WHEN D.METNO = 25 THEN METVALU ELSE 0 END) AS TURNST,
	SUM(CASE WHEN D.METNO = 26 THEN METVALU ELSE 0 END) AS SCRAP,
	SUM(CASE WHEN D.METNO = 27 THEN METVALU ELSE 0 END) AS SCRAPT,
	SUM(CASE WHEN D.METNO = 28 THEN METVALU ELSE 0 END) AS THRUP,
	SUM(CASE WHEN D.METNO = 29 THEN METVALU ELSE 0 END) AS THRUPT,
	SUM(CASE WHEN D.METNO = 30 THEN METVALU ELSE 0 END) AS CSTCOMP,
	SUM(CASE WHEN D.METNO = 31 THEN METVALU ELSE 0 END) AS CSTCOMPT,
	SUM(CASE WHEN D.METNO = 32 THEN METVALU ELSE 0 END) AS PROD
	FROM YOURLIB.yMETDTL D
	JOIN YOURLIB.yMETREPDTL RM on D.METNO=RM.METNO
	JOIN YOURLIB.yMETHDR H ON D.METNO=H.METNO
	JOIN YOURLIB.yMETREP R ON RM.REPNO=R.REPNO
	GROUP BY DIVISION, RM.REPNO, REPNAME, YR, MO, REPMON
);
 LABEL ON TABLE YOURLIB.yMETVIEW 	IS 'Monthly Metrics DB view' ;
— examples to populate reports
insert into YOURLIB.yMETREP (REPNO,  REPNAME, REPMON)  values(01,  'Sales Forecast vs. Actual' ,3) ;
insert into YOURLIB.yMETREP (REPNO,  REPNAME, REPMON)  values(02,  'Accident Reporting' ,3) ;
insert into YOURLIB.yMETREP (REPNO,  REPNAME, REPMON)  values(03,  'On-Time Delivery' ,3) ;
insert into YOURLIB.yMETREP (REPNO,  REPNAME, REPMON)  values(04,  'Sales Per Employee - Plan vs. Actual' ,3) ;
insert into YOURLIB.yMETREP (REPNO,  REPNAME, REPMON)  values(05,  'Inventory Value -Plan vs. Actual' ,3) ;
insert into YOURLIB.yMETREP (REPNO,  REPNAME, REPMON)  values(06,  'Inventory Turns - Plan vs. Actual' ,3) ;
— examples to populate metrics
insert into YOURLIB.ymethdr (METNO,  METNAME) values(01, 'Sales Actual') ;
insert into YOURLIB.ymethdr (METNO,  METNAME) values(02, 'Sales Forecast') ;
insert into YOURLIB.ymethdr (METNO,  METNAME) values(03, 'Actual  # of Accidents') ;
insert into YOURLIB.ymethdr (METNO,  METNAME) values(04, 'Target # Accidents') ;
insert into YOURLIB.ymethdr (METNO,  METNAME) values(05, 'Number of Days') ;
insert into YOURLIB.ymethdr (METNO,  METNAME) values(12, 'On-Time Delivery Actual') ;
insert into YOURLIB.ymethdr (METNO,  METNAME) values(13, 'On-Time Delivery Target') ;
insert into YOURLIB.ymethdr (METNO,  METNAME) values(10, 'Sales per Employee') ;
insert into YOURLIB.ymethdr (METNO,  METNAME) values(11, 'Sales per Employee Target') ;
insert into YOURLIB.ymethdr (METNO,  METNAME) values(22, 'Inventory Value') ;
insert into YOURLIB.ymethdr (METNO,  METNAME) values(23, 'Inventory Value Target') ;
insert into YOURLIB.ymethdr (METNO,  METNAME) values(24, 'Inventory Turns') ;
insert into YOURLIB.ymethdr (METNO,  METNAME) values(25, 'Inventory Turns Target') ;
— examples to link metrics to reports
insert into YOURLIB.yMETREPDTL (REPNO, METNO) values(01, 01) ;
insert into YOURLIB.yMETREPDTL (REPNO, METNO) values(01, 02) ;
insert into YOURLIB.yMETREPDTL (REPNO, METNO) values(02, 03) ;
insert into YOURLIB.yMETREPDTL (REPNO, METNO) values(02, 04) ;
— examples of populating metrics
insert into YOURLIB.ymetdtl ( METNO, YR, MO, DIVISION, METVALU)  values( 01, 2025, 08, 'Department47', 234567.89) ;
insert into YOURLIB.ymetdtl ( METNO, YR, MO, DIVISION, METVALU)  values( 01, 2025, 09, 'Department47', 334567.89) ;
insert into YOURLIB.ymetdtl ( METNO, YR, MO, DIVISION, METVALU)  values( 01, 2025, 10, 'Department47', 123456.89) ;
insert into YOURLIB.ymetdtl ( METNO, YR, MO, DIVISION, METVALU)  values( 01, 2025, 11, 'Department47', 423456.89) ;
insert into YOURLIB.ymetdtl ( METNO, YR, MO, DIVISION, METVALU)  values( 02, 2025, 08, 'Department47', 273456.78) ;
insert into YOURLIB.ymetdtl ( METNO, YR, MO, DIVISION, METVALU)  values( 02, 2025, 09, 'Department47', 263456.79) ;
insert into YOURLIB.ymetdtl ( METNO, YR, MO, DIVISION, METVALU)  values( 02, 2025, 10, 'Department47', 283456.90) ;
insert into YOURLIB.ymetdtl ( METNO, YR, MO, DIVISION, METVALU)  values( 02, 2025, 11, 'Department47', 293458.91) ;

insert into YOURLIB.ymetdtl ( METNO, YR, MO, DIVISION, METVALU)  values( 03, 2025, 08, 'Department 491',  129) ;
insert into YOURLIB.ymetdtl ( METNO, YR, MO, DIVISION, METVALU)  values( 03, 2025, 09, 'Department 491', 6) ;
insert into YOURLIB.ymetdtl ( METNO, YR, MO, DIVISION, METVALU)  values( 03, 2025, 10, 'Department 491',  9) ;
insert into YOURLIB.ymetdtl ( METNO, YR, MO, DIVISION, METVALU)  values( 03, 2025, 11, 'Department 491',  3) ;
insert into YOURLIB.ymetdtl ( METNO, YR, MO, DIVISION, METVALU)  values( 04, 2025, 08, 'Department 491',  10) ;
insert into YOURLIB.ymetdtl ( METNO, YR, MO, DIVISION, METVALU)  values( 04, 2025, 09, 'Department 491', 5) ;
insert into YOURLIB.ymetdtl ( METNO, YR, MO, DIVISION, METVALU)  values( 04, 2025, 10, 'Department 491',  3) ;
insert into YOURLIB.ymetdtl ( METNO, YR, MO, DIVISION, METVALU)  values( 04, 2025, 11, 'Department 491',  1) ;
— in case you need to remove or redefine these tables
drop table YOURLIB.ymetdtl;
drop table YOURLIB.yMETREP;
drop table YOURLIB.yMETREPDTL;
drop table YOURLIB.ymethdr;
— to view what you have created
select * from YOURLIB.yMETREP;
select * from YOURLIB.ymethdr;
select * from YOURLIB.yMETREPDTL;
select * from YOURLIB.ymetdtl;
— SQL statement to view result metric data for a dashboard report using report 2 information
select * from YOURLIB.ymetview where repno = 2
— Optional WHERE clause values to influence which PERIODS of report data are retrieved
— where PERIOD >= STRPERIOD
order by repno, period;
— example of changing the number of periods for a report
update YOURLIB.yMETREP
set repmon = 4  where repno = 4;
===== end =====