Monitoring IBM i With Prometheus
Jesse Gorzinski on how to use Prometheus to monitor your entire technology ecosystem, including IBM i
In my previous blog post, I demonstrated how to deploy a simple dashboard using Grafana, an open-source visualization tool. Today, we will explore a different approach. Rather than using a Grafana backend running on IBM i, we will leverage Prometheus. Prometheus defines itself as “an open-source systems monitoring and alerting toolkit.” We can use Prometheus to monitor our entire technology ecosystem, including IBM i. Using this tool, you can have access to real-time and historical data points about your system performance, operational data and much more.
Why Prometheus?
There are a few reasons why you might want to use Prometheus to monitor your infrastructure. First off, Prometheus provides the persistence of your system metrics. A simple REST-based Grafana integration, as discussed in my previous post, is a great way to provide a powerful and visually-appealing dashboard. However, Grafana doesn’t store any data. It just shows live information from its configured data sources. So, when using the REST-based configuration discussed in my last post, data is only gathered while you’re running the Grafana dashboard.
In addition, the ecosystem around Prometheus is significant. The community has provided thousands of “exporters” that can send information to Prometheus from a variety of hardware devices or software packages. The Prometheus website maintains an official list, and the default port allocations wiki page on GitHub has an even more thorough catalog of the many exporters available. This vast ecosystem is well-equipped to monitor your whole software and hardware infrastructure. In fact, you might be surprised by how much software already talks to Prometheus. For example, the WildFly exporter enables your WildFly (or JBoss) applications to publish important information.
Even further, since the Prometheus protocol is so prevalent, it is understood by a countless number of enterprise monitoring tools, both proprietary and open source! Some examples include:
- Turbonomic
- Nagios
- Splunk
- DataDog
- IBM Instana
- DataStax
- Dynatrace
- Zabbix
- And many more!
Prometheus also comes with a robust alerting system, so you can get notified when some significant event happens. The alert manager can be integrated with text messaging, email, chat systems and more.
Understanding the Topology
Before we go too far, let’s review how the various pieces will fit together. The major components are as follows:
- One or more exporters provide data about an endpoint of interest. In our case, the exporter runs on a job on IBM i. These exporters are passive exporters. That is, they don’t push data to Prometheus. Instead, they provide data to Prometheus when asked.
- An instance of Prometheus is running, often around the clock. This Prometheus instance will periodically ask (“scrape”) the exporters for metrics.
- Metrics can be inspected or visualized with a number of tools. Grafana is a common choice. It seamlessly integrates with Prometheus and has many other capabilities, thanks to a vast library of plugins. In this case, Grafana need only be launched when you hope to visualize the metrics of interest.

Figure 1. Overall topology with Prometheus and Grafana
Deploying the IBM i Prometheus Exporter
Thankfully, there is a JDBC-based tool that leverages IBM i services (SQL) to export IBM i metrics! As you might expect, this tool is open source. See the project page on GitHub for more information. Deploying the Prometheus exporter is relatively simple. Start by downloading the latest .jar file from the releases page and storing it as a stream file on your IBM i system. From there, just run:
java -jar prom-client-ibmi.jar
If this is your first time running the tool, it will ask if you’d like to create a default configuration file (config.json) with some reasonable defaults:

Figure 2. Prometheus exporter initial configuration
After that, your exporter should be running on port 9853

Figure 3. Prometheus exporter success message
That’s it! You’re now running a Prometheus exporter that exports IBM i metrics. The default configuration publishes hundreds of metrics, including:
- System activity levels (such as CPU usage)
- Memory pool information
- Apache HTTP server metrics
- The number of remote TCP connections
When you deploy to production, you probably want to deploy this exporter as a service so that it is running even after you sign out. The project page on GitHub has guidance on how to do this using the ‘nohup’ utility or Service Commander for IBM i.
Deploy the Prometheus Instance
The Prometheus instance doesn’t run on IBM i. Often, it can be deployed into a container. I chose to download the Prometheus-provided image from Docker Hub by running:
docker pull prom/prometheus
Or if using Podman:
podman pull docker.io/prom/prometheus
Prometheus is configured by YAML files. The most noteworthy are:
- prometheus.yml, the main configuration file
- alerts.yml, the configuration for the alerting system
The bare minimum configuration has a single target configured for scraping metrics. An example would look like the following, with a single target. Note that the target address and port number is where an exporter is running.

Figure 4. Sample Prometheus configuration
Once your configuration is ready, you can launch according to the image’s documenation page, specifying ‘-v’ to provide a path to your prometheus.yml file. For instance, to launch the image in a container named “prometheus”:
docker run -d --name=prometheus -v /path/to/prometheus.yml:/etc/prometheus/prometheus.yml -p 9090:9090 prom/prometheusAt this point, Prometheus should be up and running in the container at port 9090. I can access it by pointing my browser at http://<container_ip>:9090. At first, there is not much there!
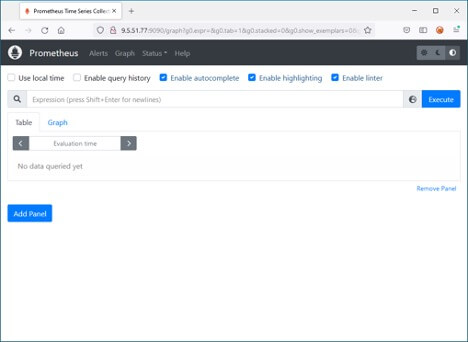
Figure 5. Initial Prometheus web view
The next step is to verify that the configured target is up. For that, just go to “Targets” under the status menu. Here, I can see the one configured target, and it is up!
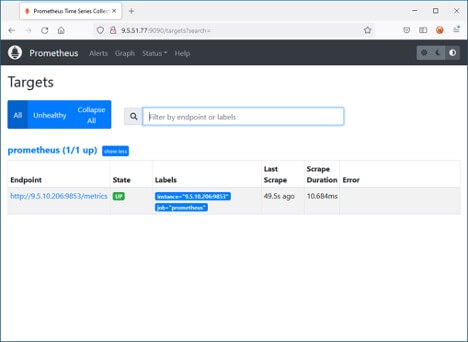
Figure 6. Target system status
Once you know the target is up, you can go to the “graph” tab and start playing around. In this screenshot, I already have some historical data, so it’s a bit more exciting than what you’ll see on first startup:
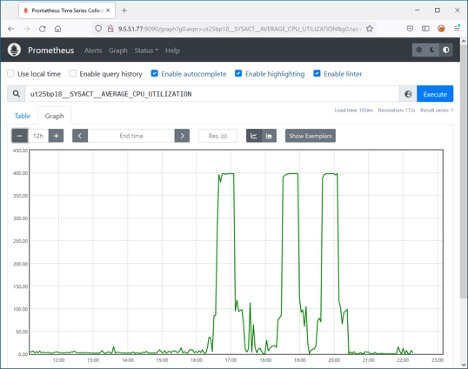
Figure 7. Graphing historical data
Deploy Grafana
Next up, we can use Grafana’s visualization engine to build a custom dashboard. We will follow the same steps to deploy Grafana as done in my previous blog post.
In this case, though, choose Prometheus as the data source type in Grafana when adding a new data source. For the address, put the address of your now-running Prometheus server.
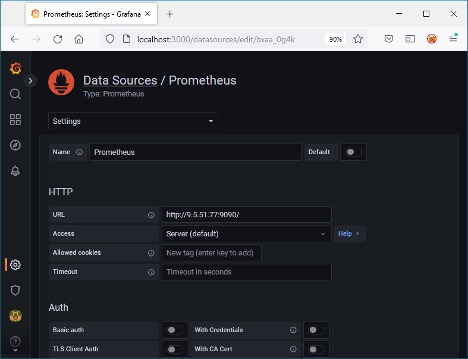
Figure 8. Prometheus data source in Grafana
With your new data source, you can now configure a dashboard in Grafana how you normally would.
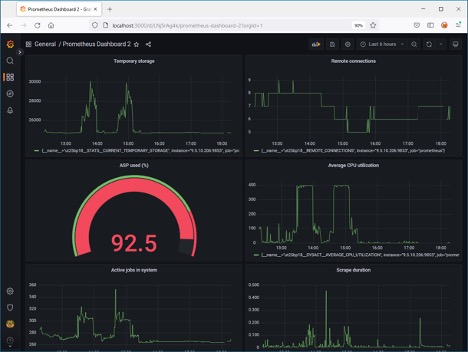
Figure 9. IBM i dashboard in Grafana
Taking Monitoring to the Next Level
In summary, Prometheus can be a very powerful tool for monitoring your IT infrastructure, especially when paired with Grafana. The IBM i exporter also gives you tons of flexibility, since can easily be extended using SQL. See the project page on GitHub for more information. In short, any numeric data that is SQL-accessible can be monitored with Prometheus. That includes your company’s operational data. Want to track expense data? Supplier lead times? Revenue? If SQL can grab it, Prometheus can scrape it! And when you add new metrics to Prometheus, they will automatically be available to Grafana as well.
Regardless of the size of your company, Prometheus is worth considering. As with any open-source project, feel free to join the community channels listed on the open-source resources page for insights and collaboration.