Understanding Disk Space Utilization With IBM i Navigator Performance Tasks
Disk space utilization is simply how much of your available disk space is in use. Understanding disk space utilization is something all shops need to do since disk space utilization tends to creep up over time. In my experience, those who are not proactive in understanding where their disk space is going often end up with unexpected problems. This blog post reviews how you can use the Performance Data Investigator, IBM i System Monitors and Graph History in Navigator for i to better understand disk space utilization.
It may not be intuitive to use the IBM i performance tasks to help you understand your disk space utilization, however disk space utilization is critical for system health. Performance suffers when disk space runs low. I have not seen any IBM documentation on recommendations for storage utilization percentages, but in my opinion exceeding 70% disk space utilization can negatively impact system performance. Even with terabytes of disk space, getting into the 80-90% utilization range can be risky.
Performance Data Investigator (PDI)
In Navigator for i, follow Performance → Investigate Data→ Collection Services to find a set of Storage Allocation perspectives, which are outlined in the PDI Collection Services navigation tree in Figure 1 below.
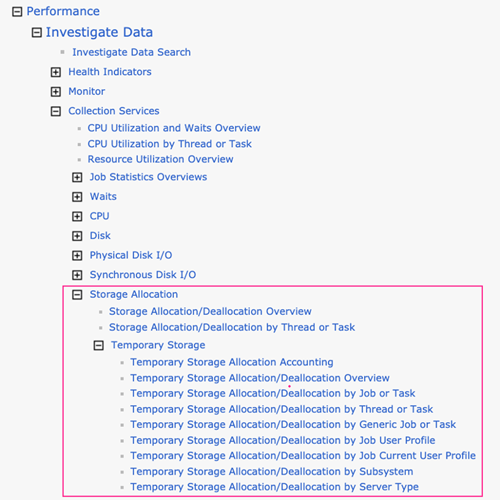
The first two perspectives display storage allocations and deallocations over time and include both temporary and permanent storage. The charts in the Temporary Storage group only depict temporary storage allocations and deallocations. For more information on the Temporary Storage charts, refer to the blog post Improved Temporary Storage Tracking (Part 4).
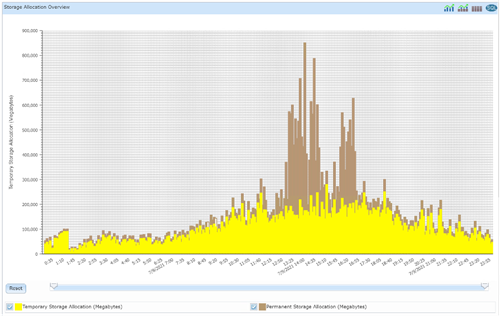
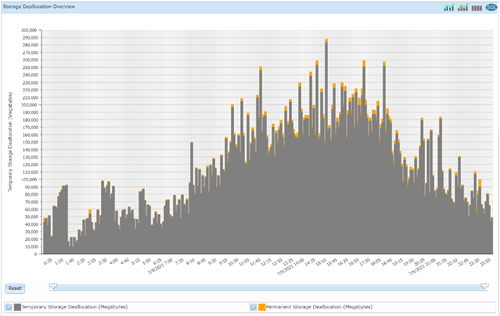
The Storage Allocation/Deallocation Overview consists of two charts: a system-wide chart showing permanent and temporary storage allocations and a similar chart showing permanent and temporary storage deallocations. If there are more allocations than deallocations, disk space utilization is increasing. In the example charts below, you can see there is much more permanent storage being allocated than deallocated. I can drill down from the Storage Allocation Overview chart to identify the jobs that are doing the permanent storage allocations. In this example, Job Watcher is running and is saving data to the Job Watcher files, which is causing the increase in permanent storage utilization. For a visual, see Figures 2 and 3.
System Monitors
There are a variety of metrics you can monitor with system monitors, including disk space utilization. You can monitor disk space utilization overall, or broken out by system ASP, user ASPs and independent ASPs. I recommend selecting disk storage utilization metrics that make sense for your specific environment. For example, if you have IASPs, you will certainly want to monitor the IASP storage utilization in addition to the system ASP utilization. You can also monitor temporary storage utilization in tandem. Figure 4 shows a list of metrics that should be monitored.
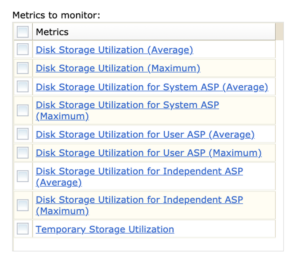
The average metric is the average utilization across all disk units in the selected ASP. The maximum metric reflects the maximum percent for the disk unit that had the peak utilization in the collection interval. If your disk units are well-balanced, average and maximum should be almost identical.
System monitors allow you to be notified if a specified threshold level is exceeded. I always recommend taking advantage of this feature to alert you about potential issues. For example, a runaway job creating a lot of files in the IFS could quickly consume large amounts of disk space.
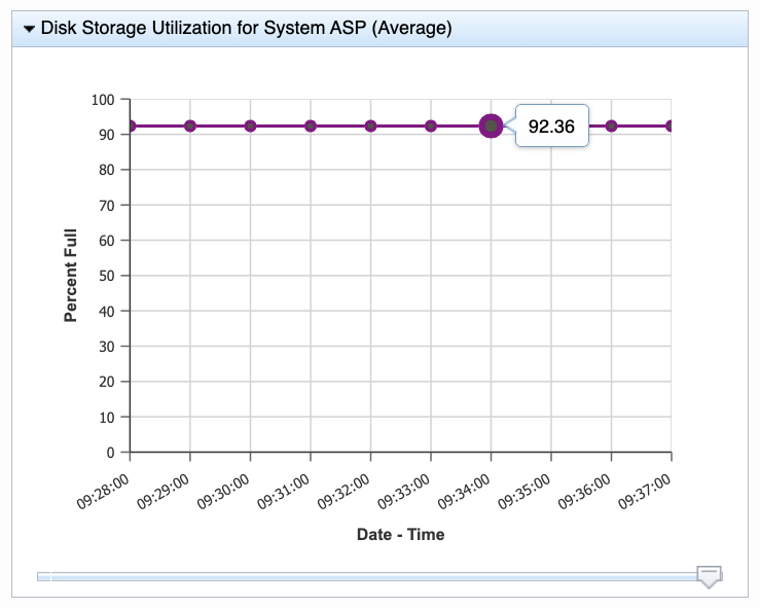
When system monitors are active, you can view the data in graphical form with the Visualize Monitor Data action. Simply hover your cursor over a data point to display the actual metric value. Figure 5 below shows that the system ASP on my demonstration system is far too high. It’s time to delete some of the performance collections I have saved.
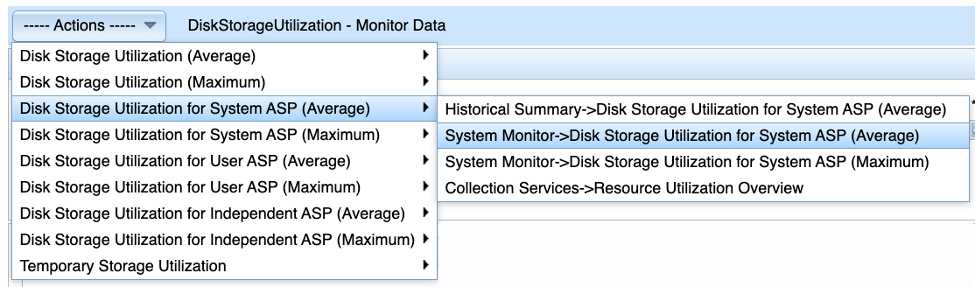
When you have started a system monitor, you can drill down to other charts by using the Actions drop down, as Figure 6 shows. You can review related system monitor metrics or launch Graph History to see the disk space utilization trends over longer periods of time.
PDI has a Monitor content package to view system monitor metrics. This is useful for reviewing detailed data for relatively short periods of time (which is three days with the default retention for system monitor data).
Note that the system monitor data only shows that the disk space utilization is increasing; you will want to use the storage allocation charts in PDI to identify whether temporary or permanent storage is being consumed, and then drill down to find the jobs that are causing the issue.
Graph History
Graph History was introduced in IBM i 7.3. Historical data collection is off by default, so you must enable this feature to use graph history. Graph history displays many metrics over long periods of time – weeks, months, and years.
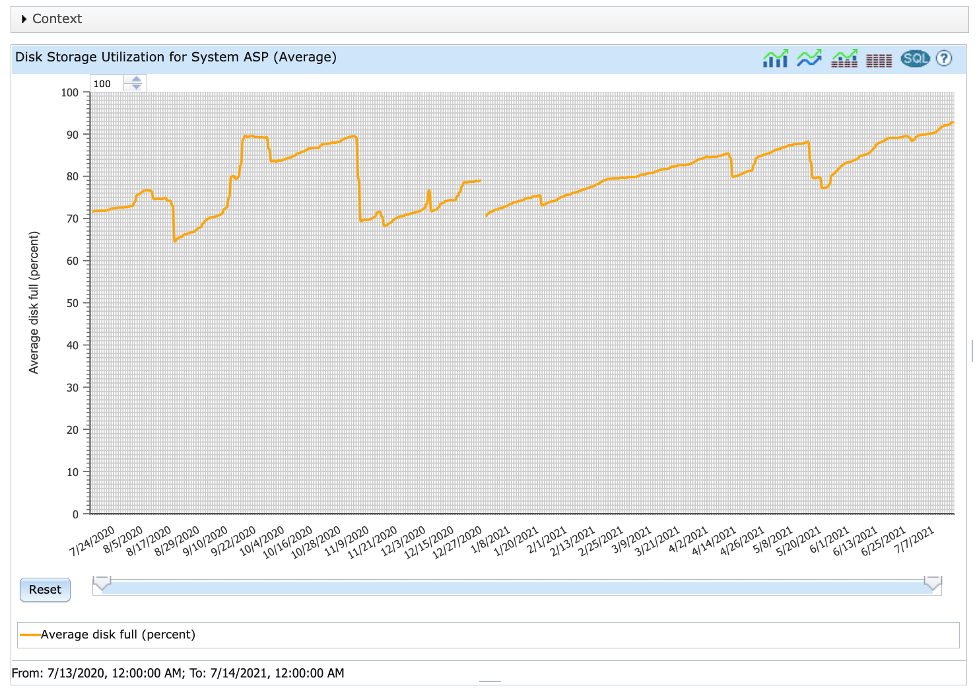
Graph History displays CPU utilization (average) by default. Expand the Context section to select different historical metrics. The disk space utilization metrics you can monitor, as described above, are all available to review from a historical perspective. Figure 7 shows an example of system ASP utilization over the past year.
Use the Performance Data Investigator to review your daily performance signature, system monitors for alerting of unexpected conditions, and graph history to understand long term trends, not only for performance management, but for overall system health.
Determining exactly what is consuming disk space is a topic for a future post.