System Monitor Configuration With Collection Services
My blog, Getting Started with IBM i Navigator System Monitors, Revisited, explained how to set up system monitors in Navigator for i. Visualize System Monitor Data showed how to view monitor data in Navigator for i and Investigate IBM i Monitor Data Using the Performance Data Investigator (PDI) explained how to review monitor data with PDI.
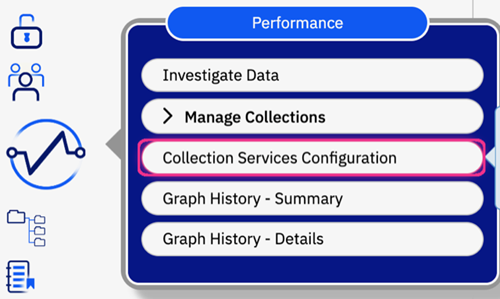
The underlying data for system monitors is collected by Collection Services. When you create the first system monitor on a partition, the system automatically adjusts the Collection Services configuration in support of the system monitor. You can fine-tune your system monitor data settings in the Collection Services Configuration task. The figure below shows where to find this task in Navigator.
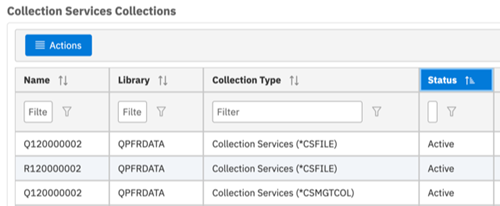
In the Collection Services Configuration task, the System Monitor Data tab displays the configuration parameters for system monitors. After creating a system monitor, the Create system monitor collection option is enabled. Do not disable this if you are using system monitors. If you have not created a system monitor, you can enable the collection of system monitor data without actually creating and starting a system monitor. If you do this, Collection Services will collect system monitor data, even though no system monitors consume that data. System monitor data is stored in the management collection object, just like standard data. However, the system monitor file-based data is stored in a collection name that begins with R, as opposed to Q for standard data. If you are collecting system monitor data, you will find three active collections when looking at Collection Services collections: one management collection object and two file-based collections, of which one is the standard data (Q*) and the other (R*) is the system monitor data.
Next in the Collection Services Configuration task you will find the retention value for monitor collections. The default is two days, which is generally a good default as system monitor collections can be large. If you wish to have system monitor data available longer, this is where you can specify how long to retain the collections. Note that the data retention value cannot be configured on a system monitor, only in the Collection Services configuration task.
Finally, you can customize the categories of data to collect. If you are manually configuring system monitor collections, select Use default monitor categories. However, you can add additional categories. In Categories to Collect, you can select categories that are not represented by metrics when defining a system monitor. You can add these additional categories to your monitor configuration, in which case data in those categories will be collected more often and can only be reviewed using PDI.
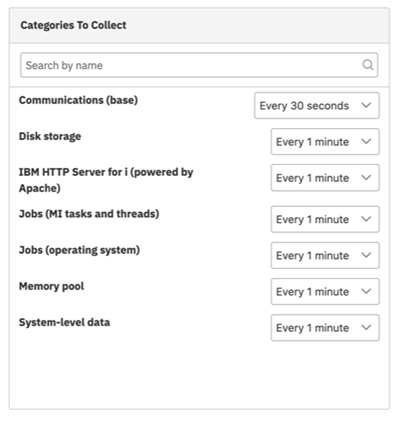
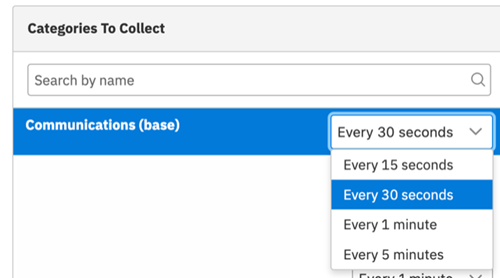
The most important aspect of the monitor categories is the ability to change the collection interval. There is a drop-down box to the right of each metric with the collection interval. Note that if you set up a system monitor with small collection intervals (anything less than one minute), that collection will take a large amount of disk space. While you can increase the interval within the system monitors properties task, this does not change the underlying collection interval for Collection Services. In order to get the Collection Services configuration changed to use a larger interval, you must change it in the Categories to Collect interface.
Collection Services is very efficient at collecting performance data, even system monitor data with small intervals; the key concern is the amount of data that is collected. Take advantage of system monitors to better understand and manage your system’s performance.